


The use of xG Stats has grown in importance rapidly in the last few years. Expected Goals (xG) isn’t just another stat. It’s the difference between betting blind and betting smart.
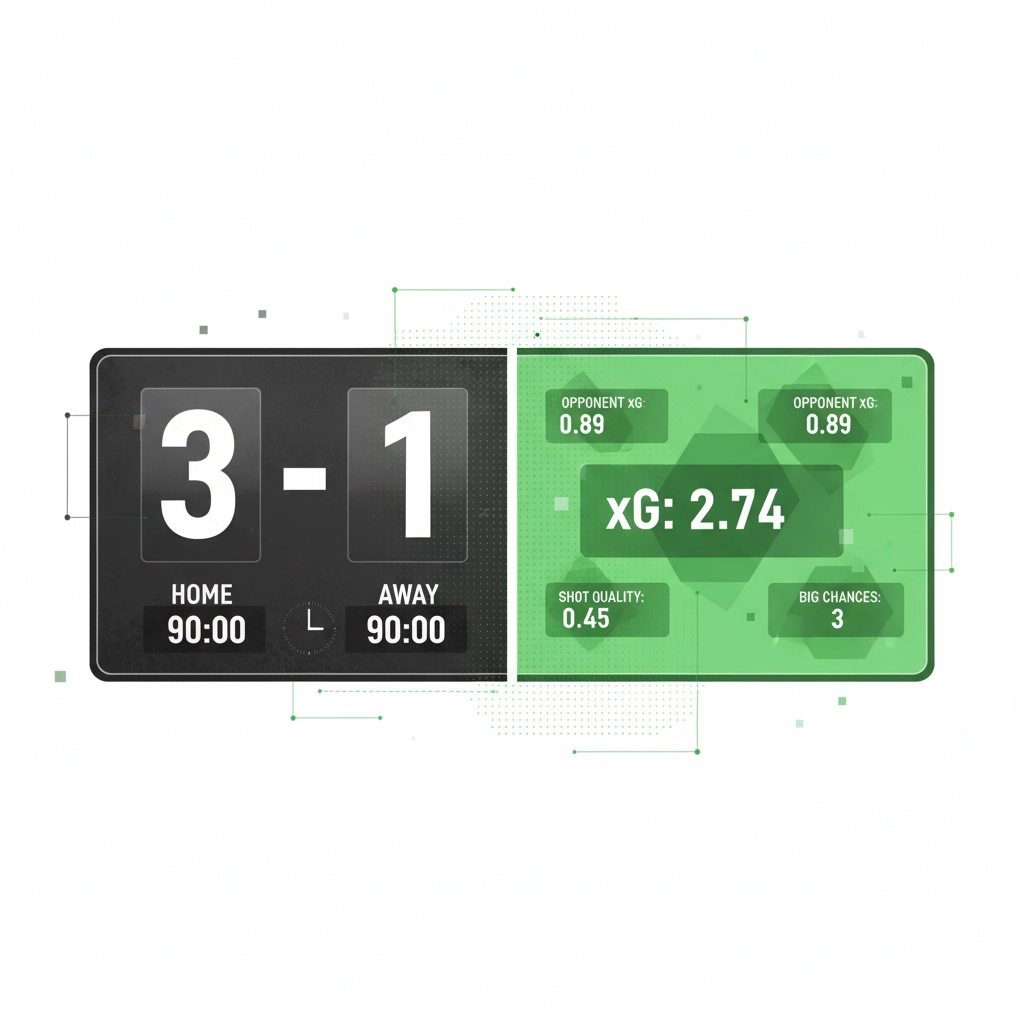
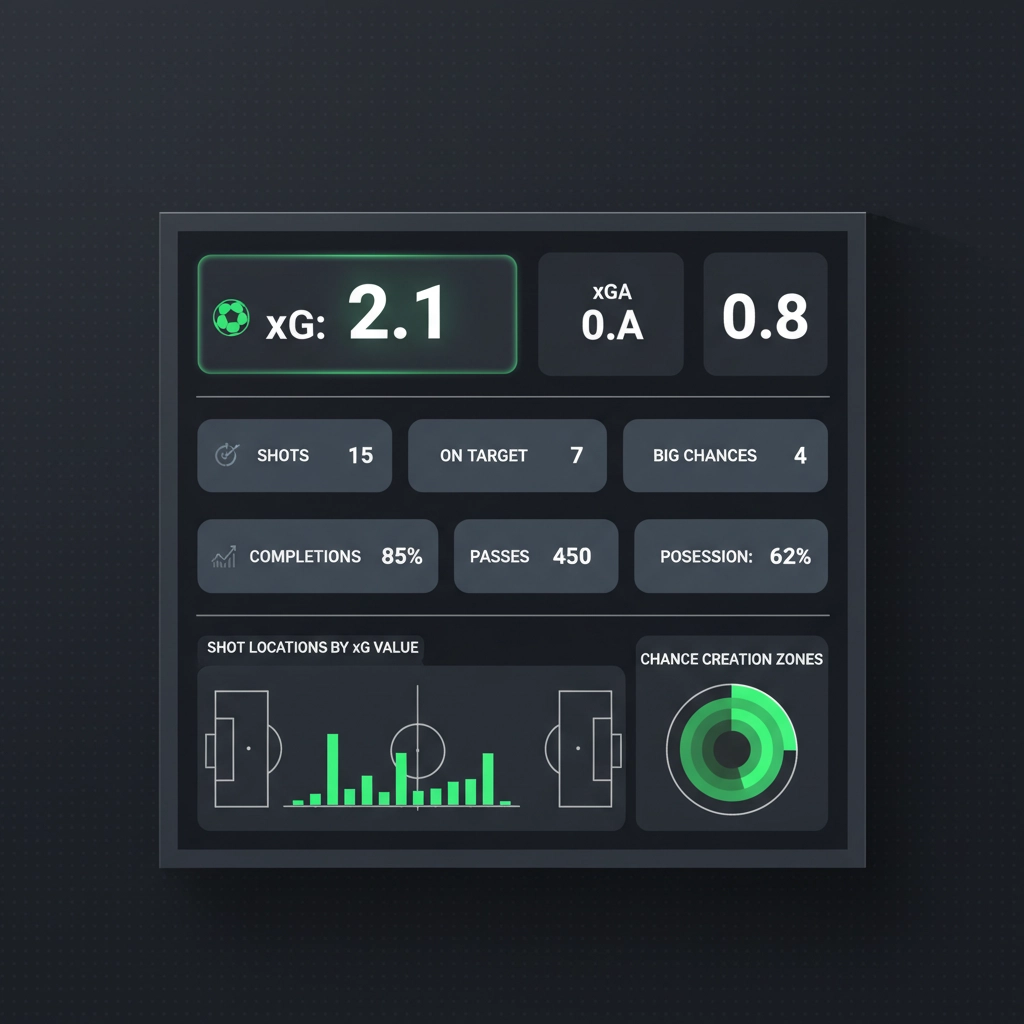
Most punters still look at final scores and think they understand football. They see Manchester City beat Brighton 3-1 and assume City dominated. But what if Brighton created chances worth 2.1 xG whilst City managed just 0.8? That changes everything.
This is why serious bettors have moved beyond goals and league tables. They use xG and xGa to see what really happened on the pitch.
Gecko Edge has tracked 8,439 AI-generated bets and recorded +398pts of profit across 66 competitions. See how the model works →
What xG Stats and Expected Goals Actually Tells You
xG stats measures the quality of scoring chances. Each shot gets a value between 0 and 1 based on where it was taken, how it was created, and the circumstances around it.
A penalty gets an xG (expected goals) of around 0.79. A long-range effort might be 0.03. Simple enough.
But here’s what makes xG powerful: it separates performance from results. A team can lose 2-0 yet create chances worth 3.2 xG. Another can win 1-0 with just 0.4 xG. Over time, performance tends to match results. The lucky team regresses. The unlucky team improves.
That’s where value lives.
What does xG Stats data really tell us?
The Biggest Betting Mistakes Punters Make With xG Stats
Mistake 1: Using Single-Game Data
For pre-match xG stats modelling, one match tells you nothing reliable. Football has too much variance. You need at least 10 games to spot meaningful xG Stats patterns.
Mistake 2: Ignoring Opposition Quality
Creating 2.5 xG against Norwich means less than 1.5 xG against Liverpool. Context matters more than raw numbers.
Mistake 3: Forgetting About Variance
xG predicts long-term trends, not individual results. Even with perfect analysis, variance will hurt you in the short term. Accept this or find another hobby.
Mistake 4: Overvaluing Finishing
Players who consistently outperform xG get labelled as “clinical”. Most revert to mean eventually. Bet on process, not purple patches.
Mistake 5: Static Analysis
Football changes constantly. Injuries, form, tactics, motivation – they all shift xG stats patterns. Use live data, not last year’s numbers.
How Gecko Edge Turns xG Stats Into Profit
Traditional xG analysis stops at basic calculations. Gecko Edge goes deeper.
We use three advanced mathematical approaches to xG stats that most bettors never encounter:
Poisson Distribution Modelling
Poisson helps predict goal distributions. If Team A averages 1.8 xG and Team B allows 1.2 xGA, we model how many goals each team will likely score. This creates probability distributions for exact scores, not just win/lose outcomes.
Bayesian Updating
Our models learn and adapt. As new data arrives, Bayesian methods update our xG stats predictions. If Liverpool’s xG performance shifts after Salah returns, our system adjusts immediately rather than waiting for manual updates.
Monte Carlo Testing
We run thousands of match simulations using current form, historical performance, and tactical matchups. This reveals the full range of possible outcomes and their probabilities. When bookmakers price a match incorrectly, Monte Carlo testing spots it.
Uncover the hidden xG stats that matter
Reading xG Stats Like a Professional
Look at Rolling Averages
Track 10-game xG performance for both teams. Smooth out the noise. Spot the trends that casual bettors miss.
Compare Home and Away Splits
Some teams create chances differently at home versus away. Factor this into your analysis.
Watch for Tactical Shifts
Manager changes, formation tweaks, or new signings alter xG patterns. Stay current with team news.
Monitor xGA Alongside xG
Attack gets attention. Defence wins money. A team creating 2.0 xG but allowing 2.2 xGA has problems.
Finding Value in the xG Stats
Value exists where perception differs from reality.
Scenario 1: Recent Bad Results, Strong xG Stats
Team creates good chances but hasn’t scored. Market undervalues them. Their prices become attractive.
Scenario 2: Lucky Winners
Team wins matches despite poor xG Stats. Market overrates them. Their opponents offer value.
Scenario 3: Regression Candidates
Consistent over or underperformance rarely lasts. Identify teams due for change in their xG stats performance.

Use AI Betting to process advanced xG stats for accurate betting predictions
Advanced xG Stats Applications
In-Play Betting
Live xG updates during matches create opportunities. If Arsenal dominates early xG against Chelsea but trails 1-0, live odds might not reflect their advantage.
Player Props
Individual xG data helps with scorer markets. Track which players get into dangerous positions regardless of recent goals.
Correct Score Markets
Combine team xG with Poisson distribution. Calculate probabilities for specific scorelines. Find odds that don’t match reality.
The Gecko Edge xG Stats Advantage
Most betting platforms give you basic xG numbers. Gecko Edge delivers actionable intelligence.
Our AI processes live data streams, adjusts for tactical changes, and identifies +EV opportunities in real-time. While others look backwards at what happened, we calculate forwards to what will happen.
We don’t just show you xG Stats. We show you what to do with it.
Live xG Stats and +EV Modelling with Gecko Edge
Building Your xG Stats Workflow
Step 1: Gather Data
Collect recent xG performance for both teams. Include home/away splits and opponent quality.
Step 2: Calculate Expectations
Estimate likely xG output for the upcoming match based on historical patterns.
Step 3: Convert to Probabilities
Transform xG expectations into win/draw/lose probabilities using statistical models.
Step 4: Compare with Market
Find odds where your calculated probabilities offer positive expected value.
Step 5: Execute and Track
Place bets with clear reasoning. Record results to improve your process.
The Reality Check
xG Stats aren’t magic. It won’t make you rich overnight.
Football remains unpredictable. Variance will frustrate you. Bad beats will happen.
But xG Stats separate the noise from the signal. It shows you what really happened and hints at what might happen next.
The bettors making consistent profits aren’t the luckiest. They’re the ones who see clearest through the data.
Gecko Edge exists because we believe technology should give you that clarity. Our algorithms process millions of data points to find the opportunities human analysis might miss.

AI Powered xG Stats Models and Betting Predictions
Getting Started with xG
Begin with simple comparisons. Look at recent xG performance between upcoming opponents. Spot obvious mismatches that bookmakers might have missed.
Don’t overcomplicate initially. Master basic xG Stats analysis before moving to advanced modelling.
Track your results. Learn from mistakes. Refine your process.
Most importantly, remember that sustainable betting success comes from finding small edges consistently, not hitting massive wins occasionally.
xG analysis provides those edges. The question is whether you’ll use them.
Ready to see football through the numbers? Gecko Edge makes it possible. Visit our platform and discover what proper xG Stats analysis can do for your betting.
Smart money follows the data. The data starts with Expected Goals.
Built by bettors. Powered by AI.
Looking for more? AI Betting vs Traditional Tipsters
Q1: What is xG (expected goals)?
xG, or expected goals, is a metric that quantifies the quality of a shot based on factors like distance, angle, body part used, and assist type. Each shot is assigned a value between 0 and 1, representing the probability that an average player would convert it. Aggregated across a match, xG measures how many goals a team should have scored based on the chances they created, independent of finishing luck or goalkeeper performance.
Q2: How is xG calculated?
xG models train on hundreds of thousands of historical shots, learning conversion rates by shot location, body part, defensive pressure, assist context, and pattern of play. Each new shot is mapped against these learned patterns and assigned a probability. Sophisticated models also factor in goalkeeper positioning, defender proximity, and shot velocity. The result is a per-shot value between 0 (effectively impossible) and 1 (open-net tap-in).
Q3: What’s the difference between xG and traditional stats like shots on target?
Traditional shot stats count volume without quality. Twenty long-range speculative efforts and twenty close-range chances both register as 20 shots, but their goal expectation is wildly different. xG weighs each shot by its chance of becoming a goal. A team with 5 shots and 2.1 xG created more genuine danger than a team with 15 shots and 0.8 xG.
Q4: Why does xG matter for football betting?
Bookmakers price markets using shot-based data, but they react slowly to consistent xG over- or under-performance. A team scoring above their xG will eventually regress to their underlying chance quality; a team scoring below it will mean-revert upward. Bettors who model xG independently can identify mispriced lines before the market corrects. Gecko Edge’s model has tracked 8,439 +EV bets generated this way, recording +398 points of profit across 66 competitions.
Q5: How do I use xG to find value bets?
Compare a team’s xG output across the last 6 to 10 matches against their actual goals scored and conceded. Persistent gaps in either direction flag opportunities the market may not have priced in. Cross-reference with expected goals against (xGA), shot location quality, and opponent strength. The strongest signals appear when xG analysis aligns with Bayesian model output and live market prices, which is where Gecko Edge filters bets through divergence checks before flagging them as +EV.