The short answer
EV % is the expected return per unit staked: probability multiplied by decimal odds, minus 1. Any positive figure is value in theory. At sensible odds, genuine edges tend to be modest. Very high figures often point to a model or data error, so check the inputs and the Sanity Score before acting.
You know that +EV means a positive expected return. This guide covers the next question: what number is worth acting on, and when a big number is a warning rather than an opportunity. Every example uses figures you can reproduce in our free expected value calculator.
What EV % measures
Expected value is the average amount you would win or lose per unit staked if you could place the same bet many times. As a percentage:
EV % = probability x decimal odds – 1
Gecko Edge has tracked 8,439 AI-generated bets and recorded +398pts of profit across 66 competitions. See how the model works →
Three steps:
- Write down your probability for the outcome as a decimal, for example 0.50.
- Multiply it by the decimal odds, for example 0.50 x 2.10 = 1.05.
- Subtract 1: 1.05 – 1 = +0.05, or +5%.
A positive figure means the price pays more than the probability justifies. Zero means a fair bet. A negative figure means the price pays less, so you would expect to lose money over many similar bets. That is what negative EV means in betting. Because the bookmaker’s margin is built into the prices, a price that looks fair is usually a little below fair once the margin is counted, so a small negative EV is the normal starting point.
The same idea can be put another way: EV % is the gap between the price on offer and the fair odds. Fair odds are 1 / probability, so a 50% chance has fair odds of 2.00. A price of 2.10 sits 5% above fair, and the EV is +5%. For the basics in more depth, see our knowledge base article what does EV mean and how should I use it? and expected value demystified.
Worked examples at different prices
Hold the probability at 50%, so fair odds are 2.00, and change only the price:
| Decimal odds | Fair odds | EV % |
|---|---|---|
| 1.90 | 2.00 | -5.00% |
| 2.00 | 2.00 | 0.00% |
| 2.10 | 2.00 | +5.00% |
| 2.20 | 2.00 | +10.00% |
| 2.40 | 2.00 | +20.00% |
Each 0.10 of price adds 5 points of EV at this probability. On paper, the 2.40 line looks four times better than the 2.10 line. In practice, a 50% outcome priced at 2.40 would be an unusually large mispricing, so a figure like +20% should prompt the question: is the probability right?
Why a bigger EV % is not always better
A large EV figure has two possible explanations. Either the market has mispriced the outcome badly, or the probability behind the calculation is wrong. The second is easy to underestimate, and it is the reason a very high figure deserves a second look.
Sensitivity: a small probability error moves EV a lot at long odds
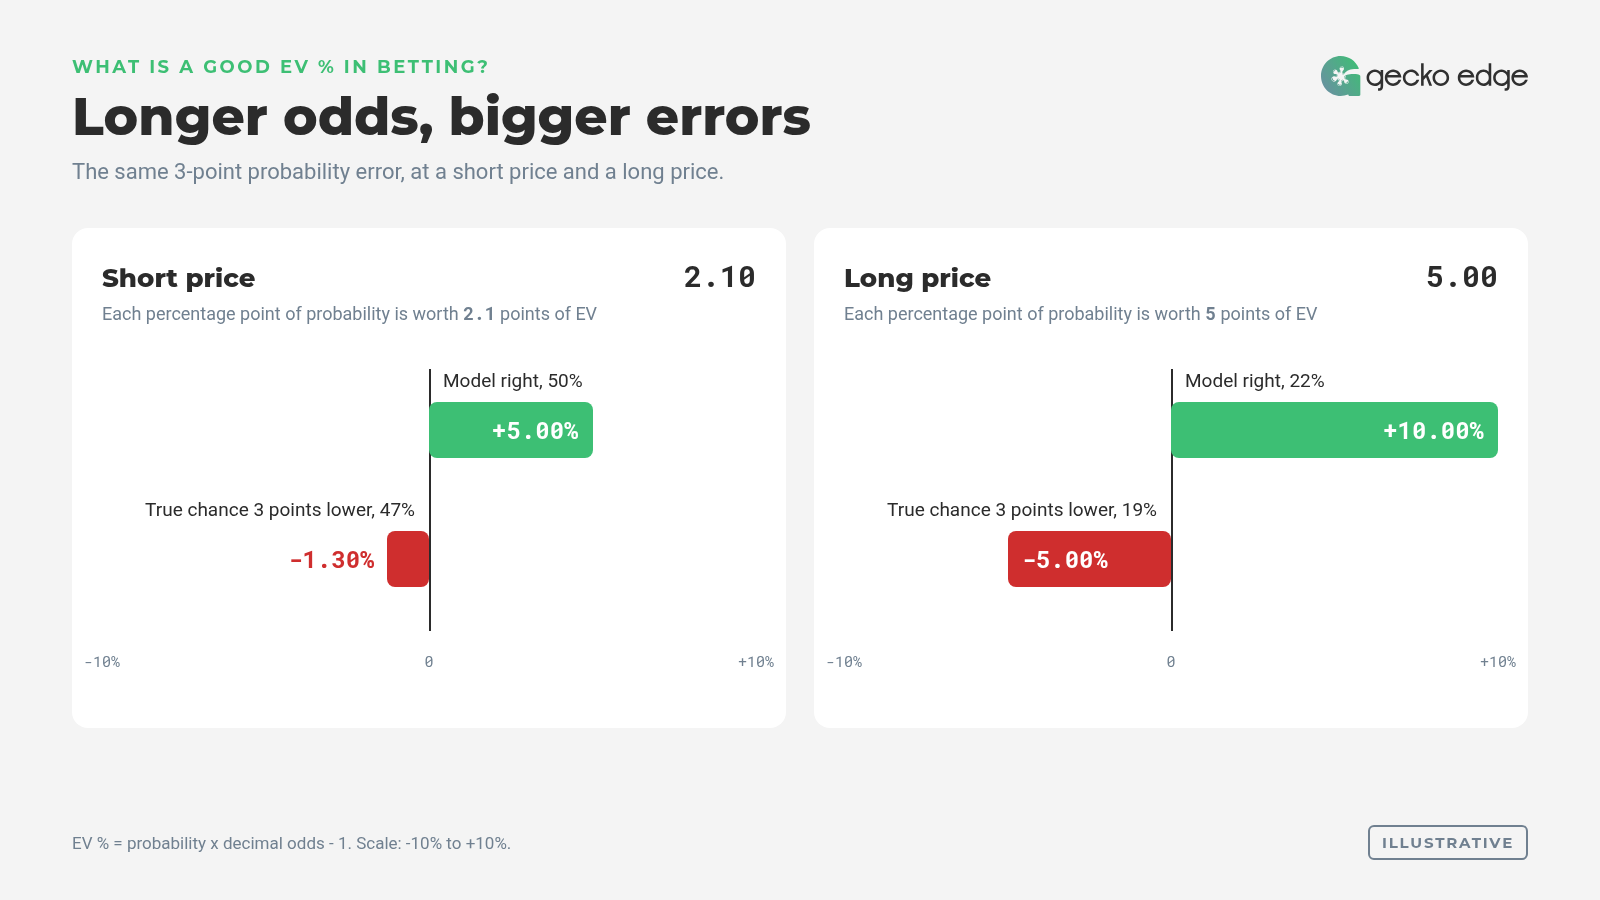
Here is what happens when the probability is three percentage points too high:
| Scenario | Odds | True probability | EV % |
|---|---|---|---|
| Short price, model right | 2.10 | 50% | +5.00% |
| Short price, model 3 points high | 2.10 | 47% | -1.30% |
| Long price, model right | 5.00 | 22% | +10.00% |
| Long price, model 3 points high | 5.00 | 19% | -5.00% |
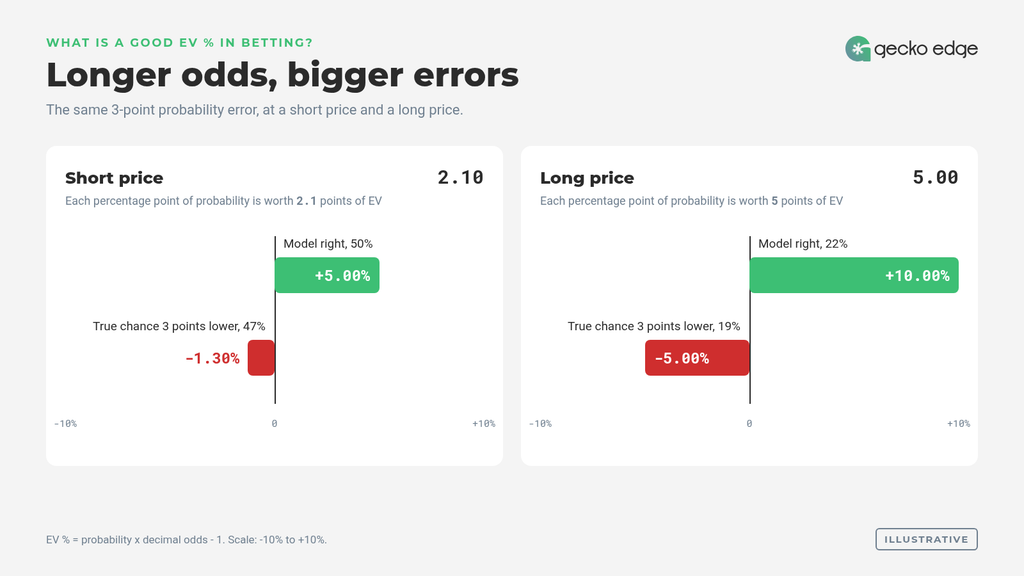
At 2.10, each percentage point of probability is worth 2.1 points of EV. At 5.00 it is worth 5 points. The longer the price, the more a small modelling error inflates the edge.
Look at the long-price rows. On the model’s figures, the bet shows +10.00%. If the true probability is three points lower, an error of a size any model can make, the same bet is -5.00%. The headline number doubled the short-price edge, but it is also far more fragile.
Thin data, stale prices and extreme gaps
Three other things inflate EV figures:
- Thin data. Early in a season, after a manager change or for a promoted side, a model has less evidence to work from. Probabilities carry more uncertainty, and so do the EV figures built on them.
- Stale prices. A price that has moved since the analysis ran can make an old EV figure look better than the current market allows. Our article on why +EV numbers change between the league scan and the single-fixture view explains one common cause.
- Extreme gaps. When the model and the market disagree sharply, the market may be reacting to information the model has not seen, such as team news. That is what the divergence flag is for.
What a good EV % looks like in practice
Markets and odds ranges
Goals markets and Asian Handicaps usually sit at prices near evens. At those odds, a probability error costs about two points of EV per percentage point, so a modest edge is relatively robust. Long-odds outcomes, such as big-priced outsiders or correct scores, amplify every error. The same EV figure carries more risk of being wrong at 5.00 than at 2.10.
Liquidity matters too. Heavily traded markets absorb information quickly, so large gaps there tend to close fast or to signal something the model has missed. Smaller markets can hold gaps for longer, but the prices are also easier to move and the data behind them is often thinner.
That is why the direct answer says genuine edges tend to be modest at sensible odds. A small, positive figure on a well-traded market near evens is the usual pattern of a real edge. A very large figure, especially at long odds, is a cue to check the inputs.
Pairing EV with the Sanity Score
EV tells you the size of the gap. The Sanity Score (0 to 10) tells you how much to trust it: how strongly the modelling agrees, with fresh odds. Read together, they give a far better picture than either alone.
Gecko Edge’s knowledge base suggests Sanity 7+ alongside +EV 5%+ as a starting filter; the right threshold depends on the market and the odds.
The Sanity Score can also tell you not to act. A high EV on a low Sanity Score is a flag, not a cue. See what the Sanity Score actually means for how it is built.
In Gecko Edge, the market tables show the bookmaker odds, implied probability, model probability, fair odds and EV % for each outcome, with the Sanity Score beside them. You can see EV % and fair odds on every market in a fixture analysis.
From EV % to stake size
Flat staking first. The simplest approach is to stake the same amount, for example 1 point, on every bet that passes your filter. Flat stakes are easy to review, and they stop a single over-estimated edge from doing outsized damage. Our article on staking and bankroll treats this as the starting point.
Kelly as an option. The Kelly criterion scales the stake with the edge:
Full Kelly stake = EV / (odds – 1)
At +5.00% EV and odds of 2.10: 0.05 / 1.10 = 4.55% of bank. Quarter Kelly: 1.14%.
The trade-off is that Kelly assumes your probability is right. If the EV is overstated, as in the sensitivity table above, full Kelly stakes too much, and the swings in your bank can be large. Fractional Kelly, such as a quarter, reduces both the stake and the damage from errors. You can work through the numbers with our Kelly criterion calculator.
What to expect from a run of +EV bets
Expected profit is straightforward: multiply the number of bets by the average EV and the stake. 200 bets at +5% average EV, 1 point each, gives an expected profit of +10.00 points.
That is the average you would expect, not what any one run will show. How many bets it takes before results mean much is covered in Closing line value (CLV) explained for football bettors.
What else to check besides EV
Before acting on any EV figure, run through:
- Sanity Score. Is the modelling in agreement, with fresh odds?
- Flags. Is there a divergence or anything else unusual?
- Team news. Have line-ups landed since the analysis ran?
- Price. Is the price you can actually get still above fair?
- Odds range. Is the edge on a price near evens, or on a long price where errors grow?
FAQ
What is a good EV in betting?
Modest edges at sensible odds are the usual pattern; very large figures deserve a second look.
How do you calculate EV %?
Multiply your probability by the decimal odds and subtract 1. For example, 0.50 x 2.10 – 1 = +5%.
What does negative EV mean?
The price is lower than the probability justifies, so you expect to lose money over many similar bets.
Is a 20% EV bet better than a 5% one?
Not automatically. A 20% figure is more likely to include a modelling or data error, especially at long odds.
Does a +EV bet always win?
No. EV describes the average over many bets; any single bet can lose.
How does Gecko Edge show EV?
Each market in a fixture analysis shows the model probability, fair odds and EV %, alongside a Sanity Score for confidence.
Should I stake more on higher EV?
Some bettors scale stakes with the edge (for example fractional Kelly). Flat stakes are simpler and easier to review.
18+ only. Gecko Edge provides football analytics data for information and entertainment. It does not place bets and no outcome is certain. Bet responsibly, only with money you can afford to lose, and set limits before you start. Free, confidential support: GamCare (https://www.gamcare.org.uk).
Betting responsibly: limits, discipline and where to get support
Try Gecko Edge for free. No card needed.
Last reviewed: 3 November 2026