The short answer
A value bet is one where the odds pay more than the outcome’s true probability justifies. To find one, estimate the probability yourself or with a model, convert it to fair odds, strip the bookmaker’s margin from the market, and compare. If the price beats your fair odds, the bet is positive expected value (+EV).
This guide sets out a repeatable seven-step process, works through one full Over 2.5 Goals example with every figure shown, and explains which checks matter before you act. You can reproduce each number with our free no-vig calculator, implied probability calculator and expected value calculator.
What a value bet is (and is not)
Value is a price measured against a probability, whichever team you expect to win.
As an illustration (these are not live prices), a heavy favourite at 1.30 can be poor value if its true chance of winning is only 70%, because 1.30 implies about 77%. An outsider at 6.00 can be good value if its true chance is 20%, because 6.00 implies only 16.67%. The useful question is whether the price pays more than the probability justifies.
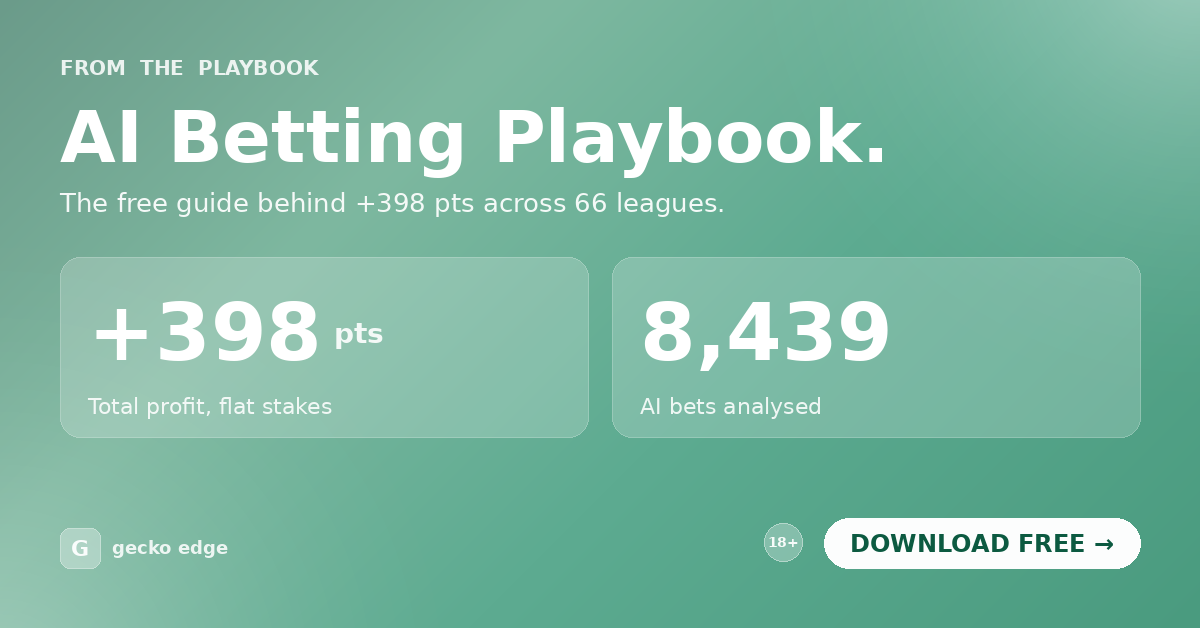
Gecko Edge has tracked 8,439 AI-generated bets and recorded +398pts of profit across 66 competitions. See how the model works →
That shift matters because it changes what you look for. The search is for gaps between two numbers rather than for likely winners: the probability the market is charging for, and the probability you believe is closer to the truth. When the gap is in your favour, the bet has positive expected value. Over many similar bets, positive expected value is what separates a sound process from guesswork.
It also explains why value bets lose regularly. In an illustrative case, a bet at 2.20 with a true 50% chance is +10% EV (0.50 x 2.20 – 1), and it still loses half the time. Value is about the average across many bets, not the result of the next one. For a longer look at the idea, see the anatomy of a value bet.
The 7-step process
Screenshots show the Gecko Edge app on a real fixture, captured before kick-off; figures change as prices move.
Step 1. Build a shortlist
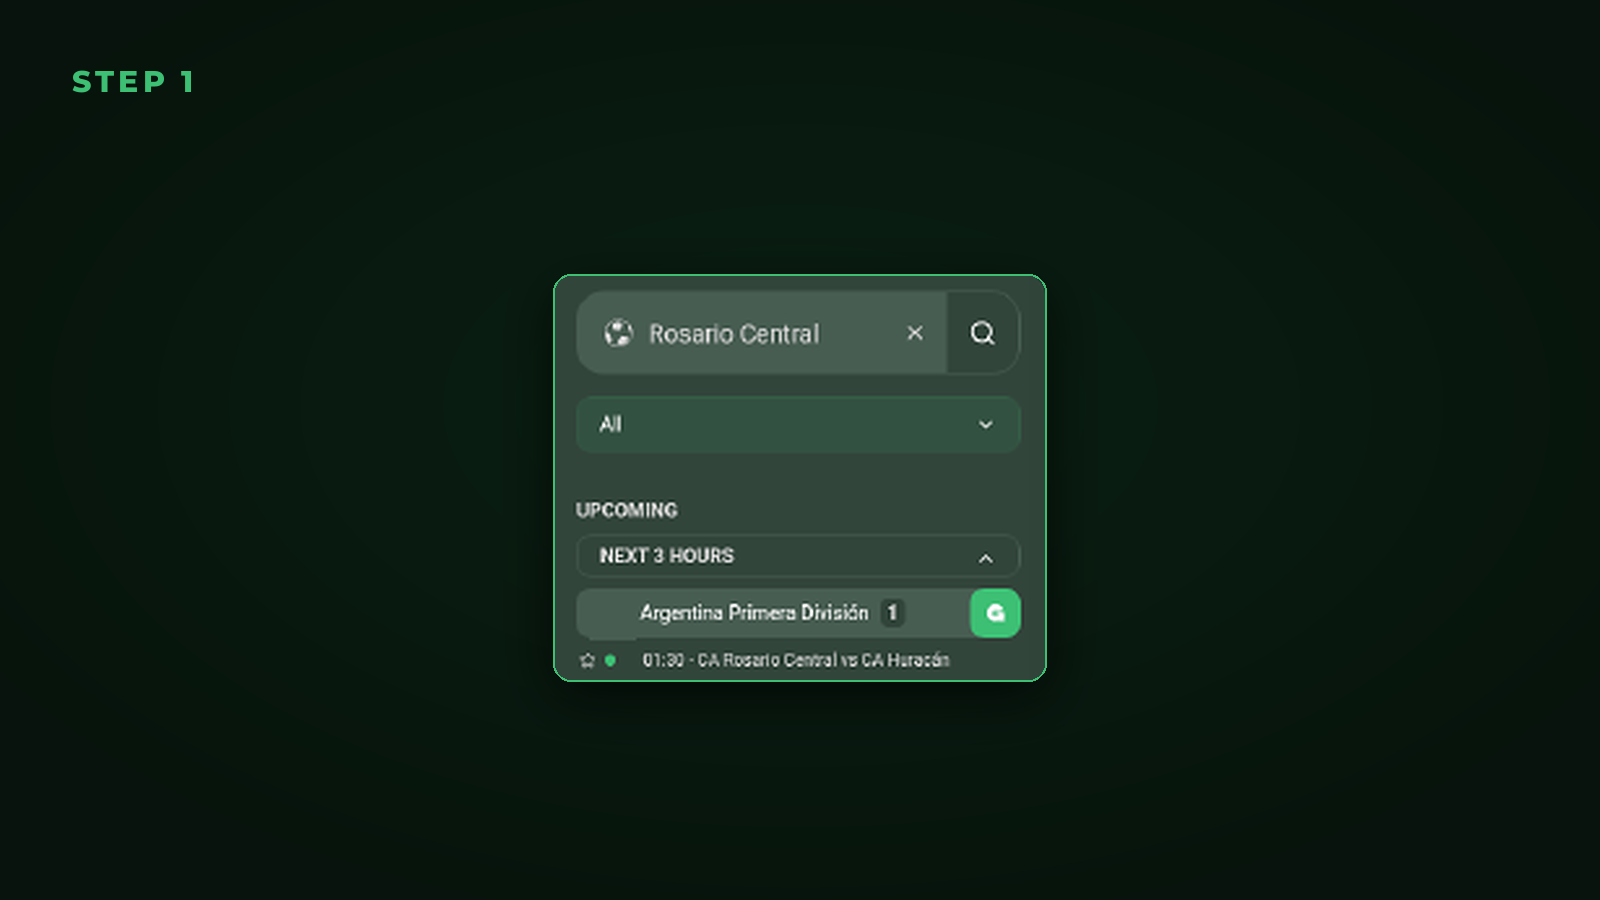
You cannot price every match in every league by hand, so start by narrowing the field. There are two sensible routes. You can stick to leagues you know well, where you have a feel for team news and context. Or you can scan a whole league for fixtures where the model and the market disagree, then look more closely at those.
In Gecko Edge, you can run a league scan to see which fixtures show a gap worth checking. If a scan throws up more candidates than you can sensibly review, our knowledge base explains how to focus when lots of fixtures show value.
Step 2. Get a probability for the market
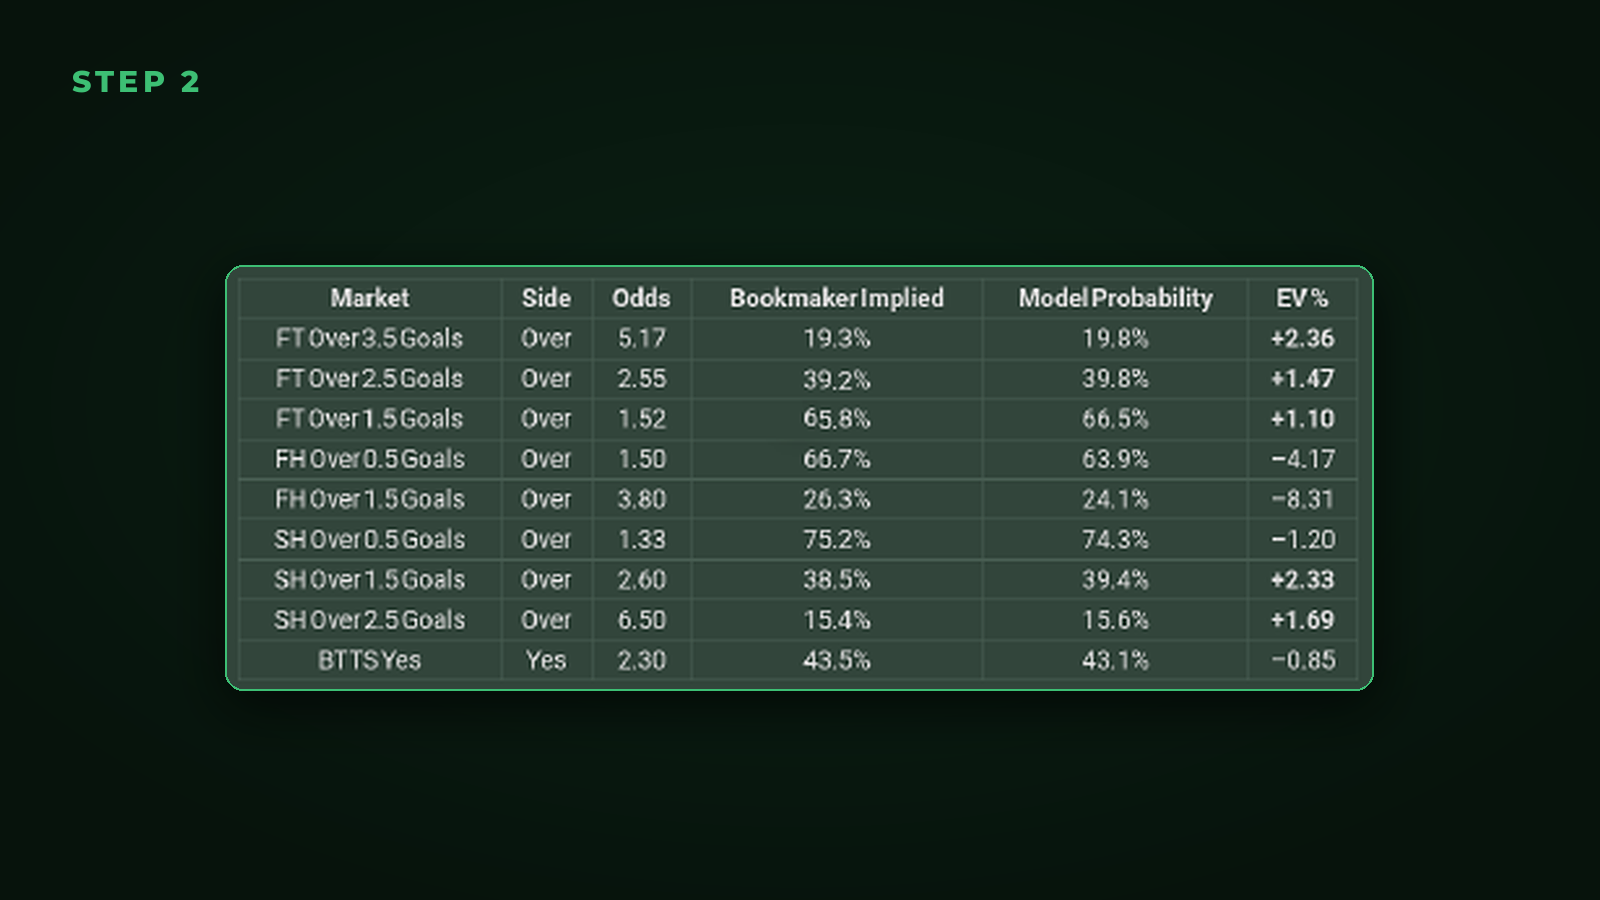
This is the step that decides everything else. Every later calculation depends on the probability you start with, so it needs to come from a consistent method.
A goals model typically builds that probability in layers. Expected goals (xG) data feeds goal-rate estimates for each side. A Poisson grid turns those rates into a probability for every scoreline. A Dixon-Coles correction adjusts the low scores that a plain Poisson model handles poorly. A Bayesian blend then combines that view with other evidence. Sum the right scorelines and you have a probability for any goals market.
In Gecko Edge, you click a pre-built smart prompt on a fixture and the analysis returns model probabilities for each market. Our Smart Prompt library explains what each prompt covers and when to use it, and our guide on how to read a fixture analysis output walks through each section.
Step 3. Convert it to fair odds
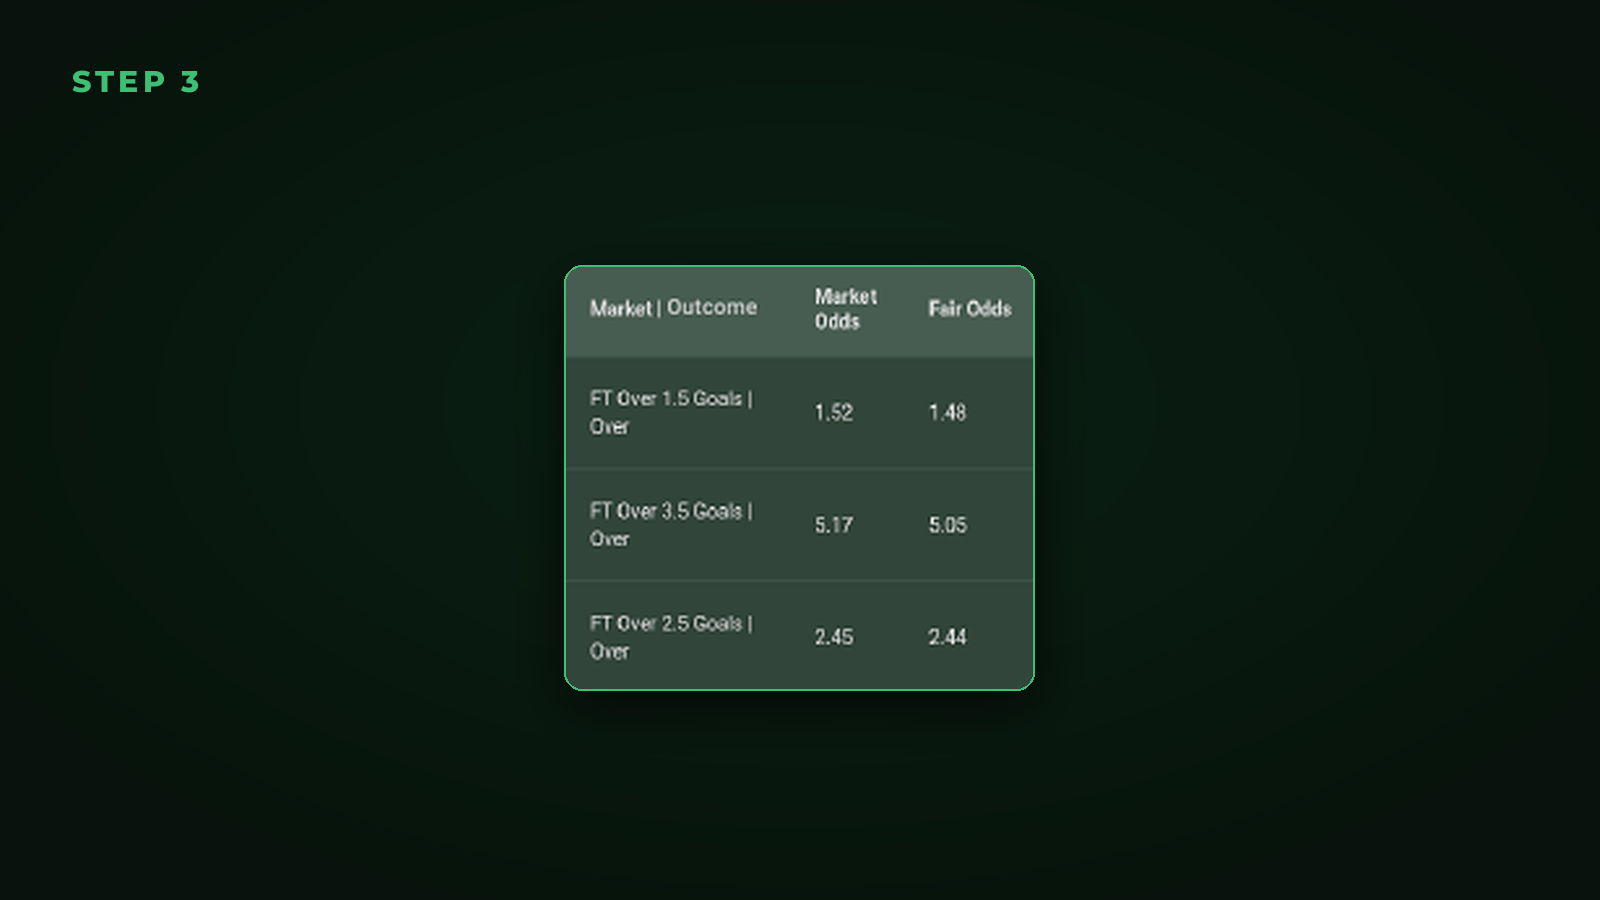
Fair odds are the price at which a bet would break even over the long run. The formula is simple:
Fair odds = 1 / probability
A 55% probability gives fair odds of 1 / 0.55 = 1.82. Any price above 1.82 pays more than that probability justifies. Any price below it pays less. Fair odds give you a single number to hold the market against. Write it down before you look at the prices, so the market cannot anchor your view, and keep the same method for every bet so your records stay comparable.
Step 4. Strip the margin from the market price
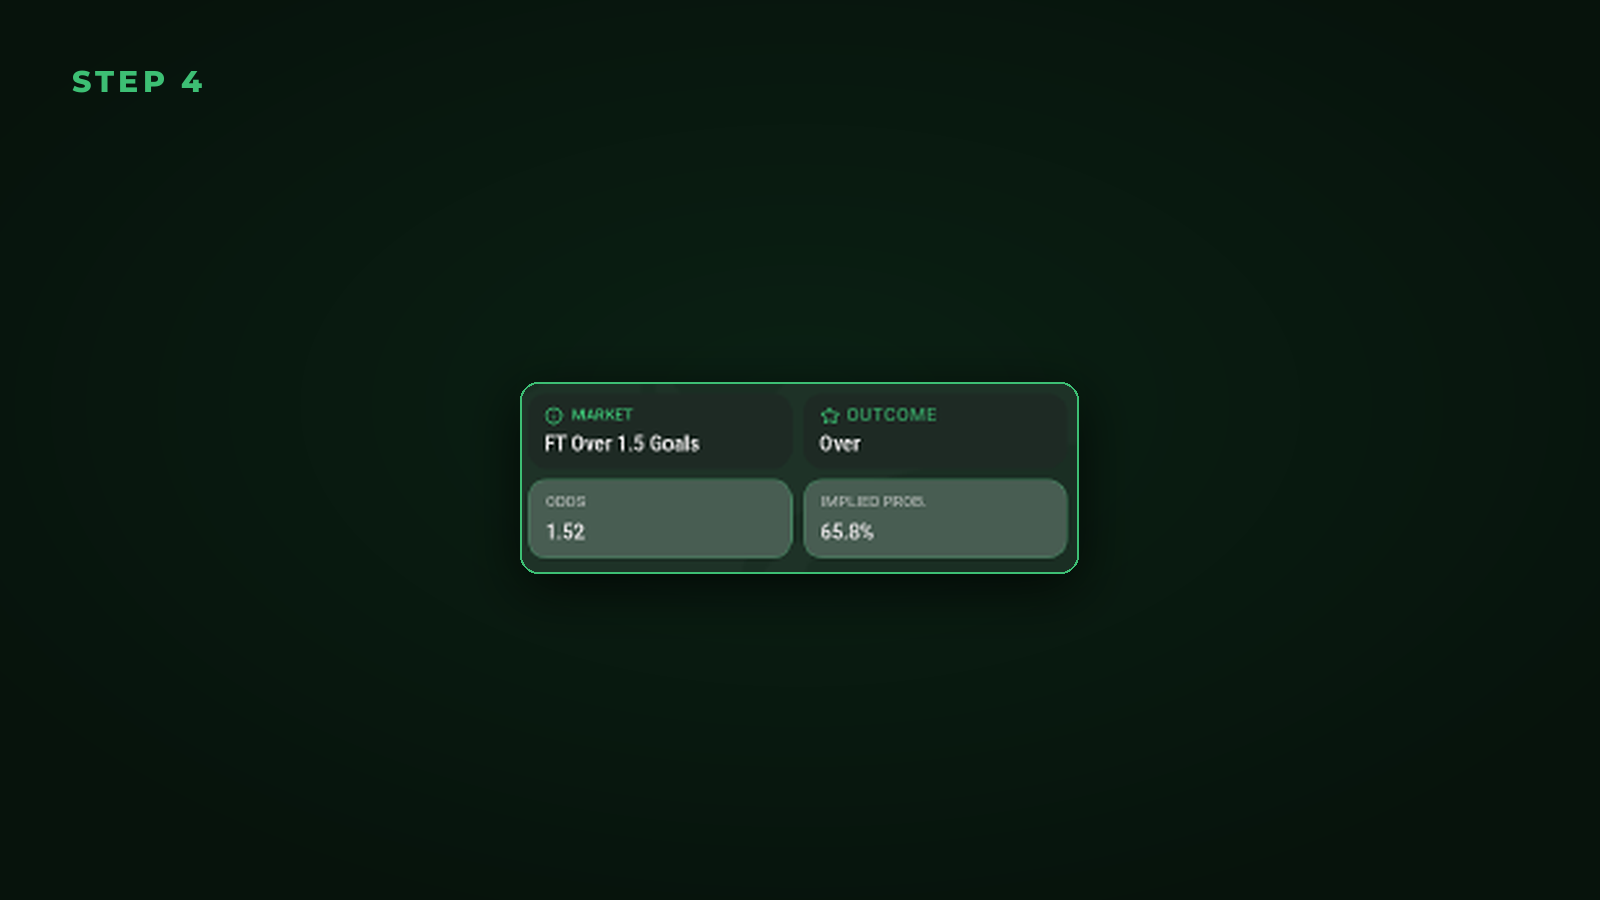
Bookmaker prices include a margin, so the implied probabilities on both sides of a market add up to more than 100%. To see what the market itself is saying about the outcome, remove that margin first.
- Convert each price to an implied probability: 1 / odds.
- Add the implied probabilities together. The amount over 100% is the margin.
- Divide each implied probability by that total. The results add up to 100% and give a no-margin market view.
This is the difference between implied probability and true probability. The implied figure includes the bookmaker’s margin. The no-margin figure is the market’s own estimate. Our article on the relationship between market odds and fair price covers this in more depth.
Step 5. Calculate EV and compare
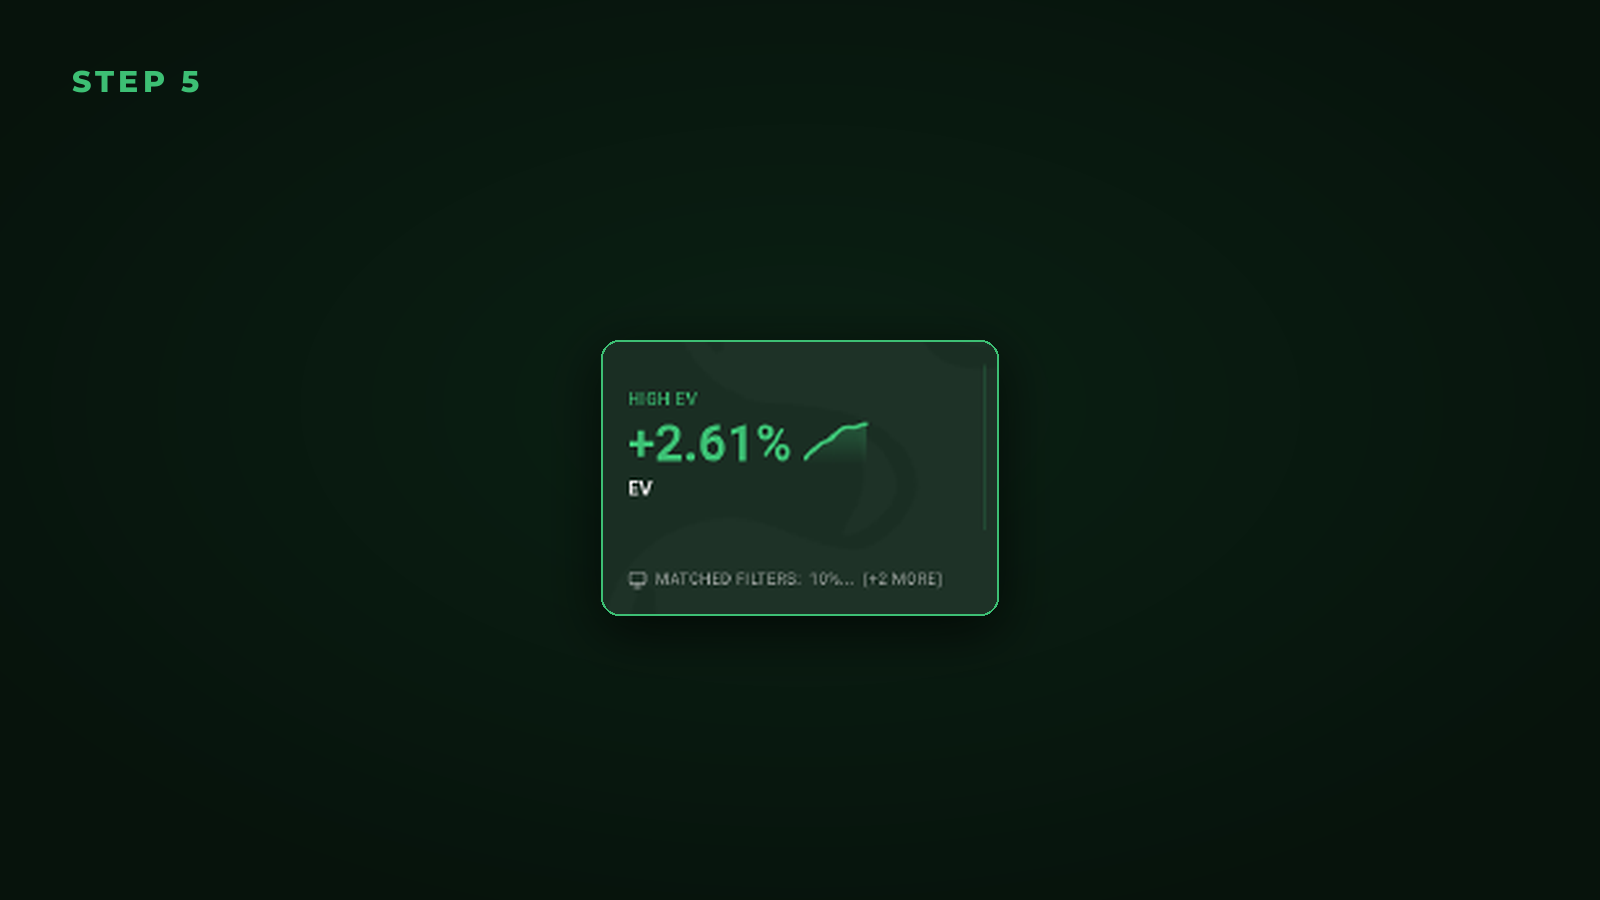
Expected value tells you how much you would expect to win or lose per unit staked, on average, if you could place the same bet many times.
EV = probability x decimal odds – 1
Above zero is +EV. Zero is a fair bet. Below zero is -EV. You can compare it two ways and reach the same answer: either the price is higher than your fair odds, or the EV is positive. If you want the maths in more detail, see expected value demystified.
How big the gap needs to be before it is worth acting on depends on the market and the odds; our guide to what a good EV % in betting looks like covers thresholds in full.
Step 6. Check the quality of the number
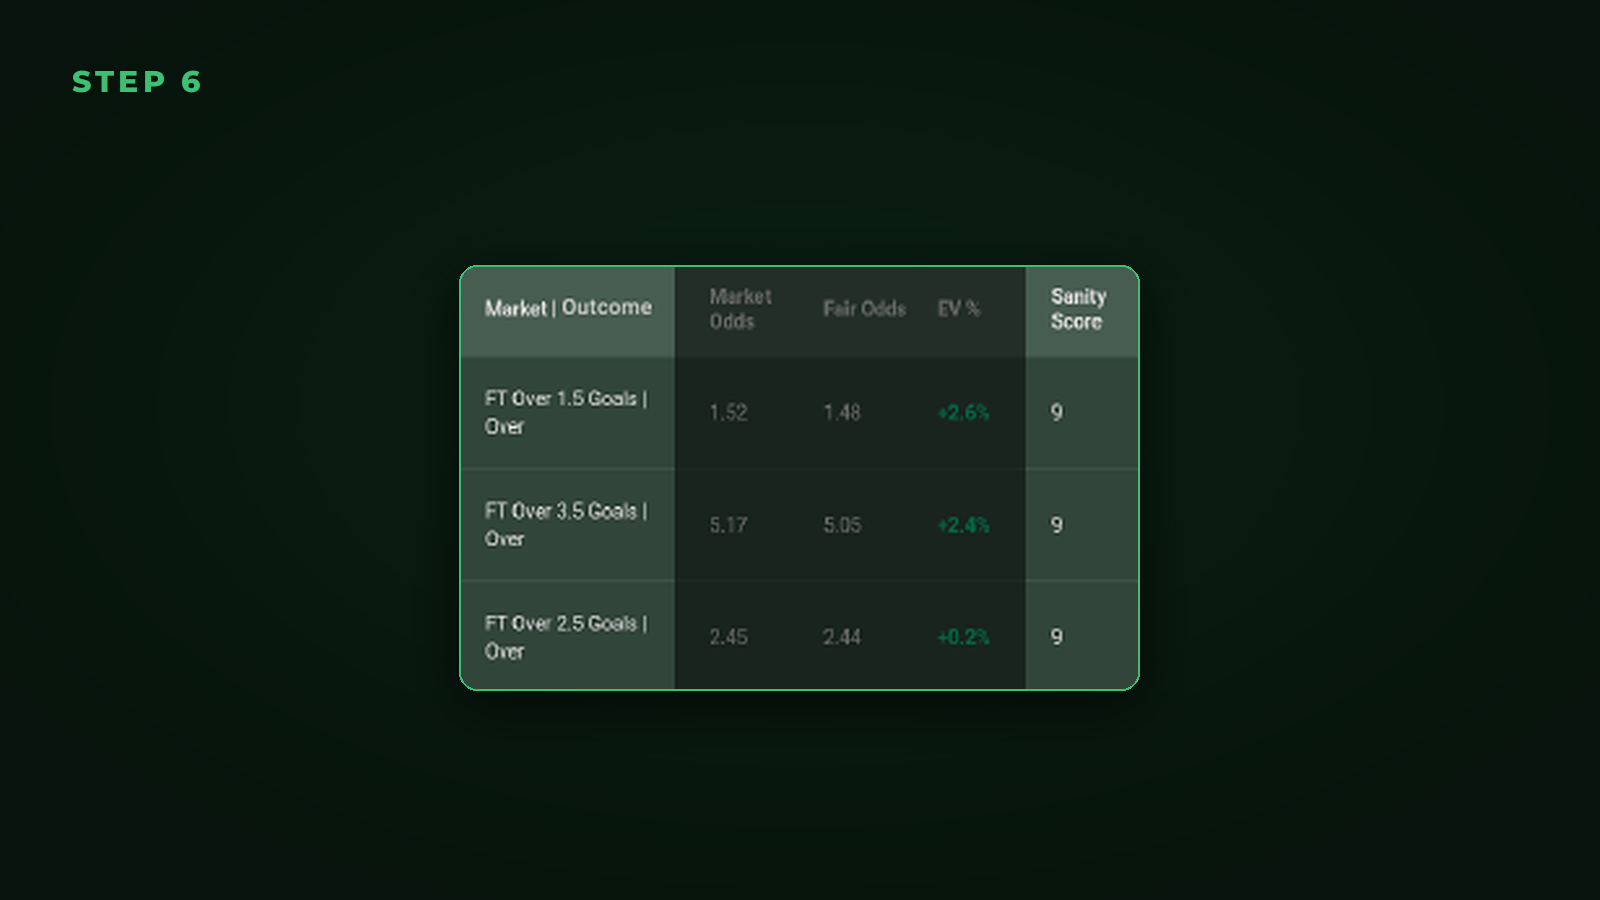
A large EV figure is only as good as the inputs behind it. Before acting, check:
- The Sanity Score (0 to 10). It measures how strongly the modelling agrees, with fresh odds. A high EV on a low Sanity Score is a reason to look harder, not a reason to act. See what the Sanity Score actually means.
- Flags. Unusual signals, such as a large divergence between the model and the market, are flagged in the analysis.
- Team news. If line-ups have not landed, the price may already know something the model does not.
- Data freshness. A price that has moved since the analysis ran can turn a +EV line into a -EV one.
Step 7. Stake consistently and record the odds you took
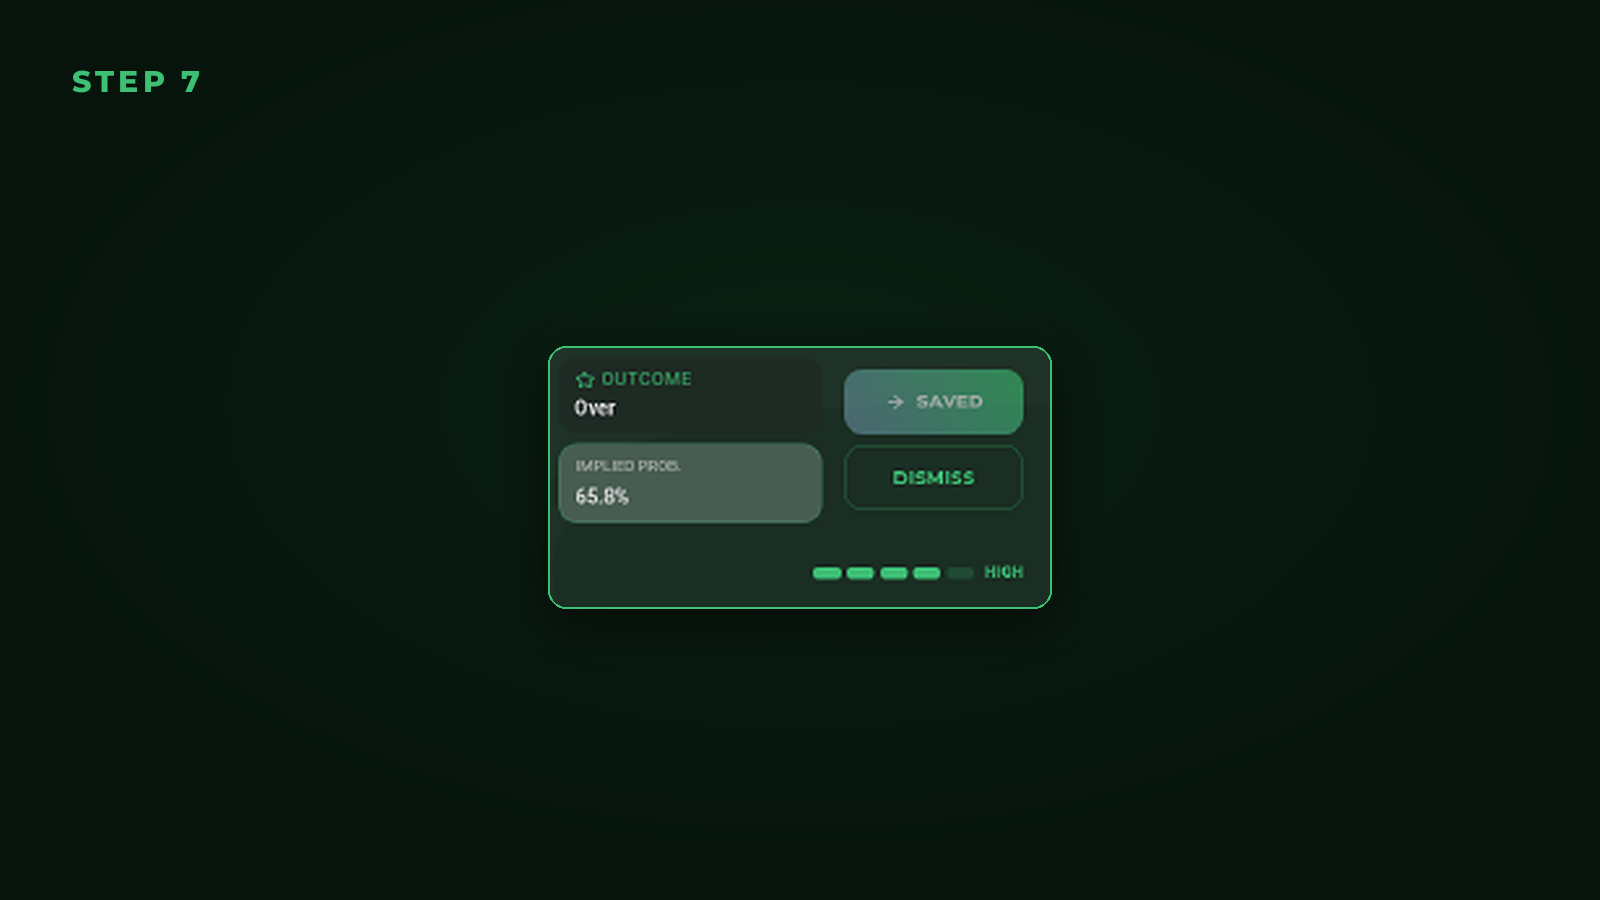
A sound process needs consistent stakes and accurate records of the price you actually got, not the price you saw. Flat stakes are the simplest starting point because they make results easy to review. Our article on staking and bankroll sets out the options.
The +EV Bet Tracker lets you record the odds you took.
Worked example: Over 2.5 Goals
Here is the full process on one market, with illustrative figures, not a live fixture.
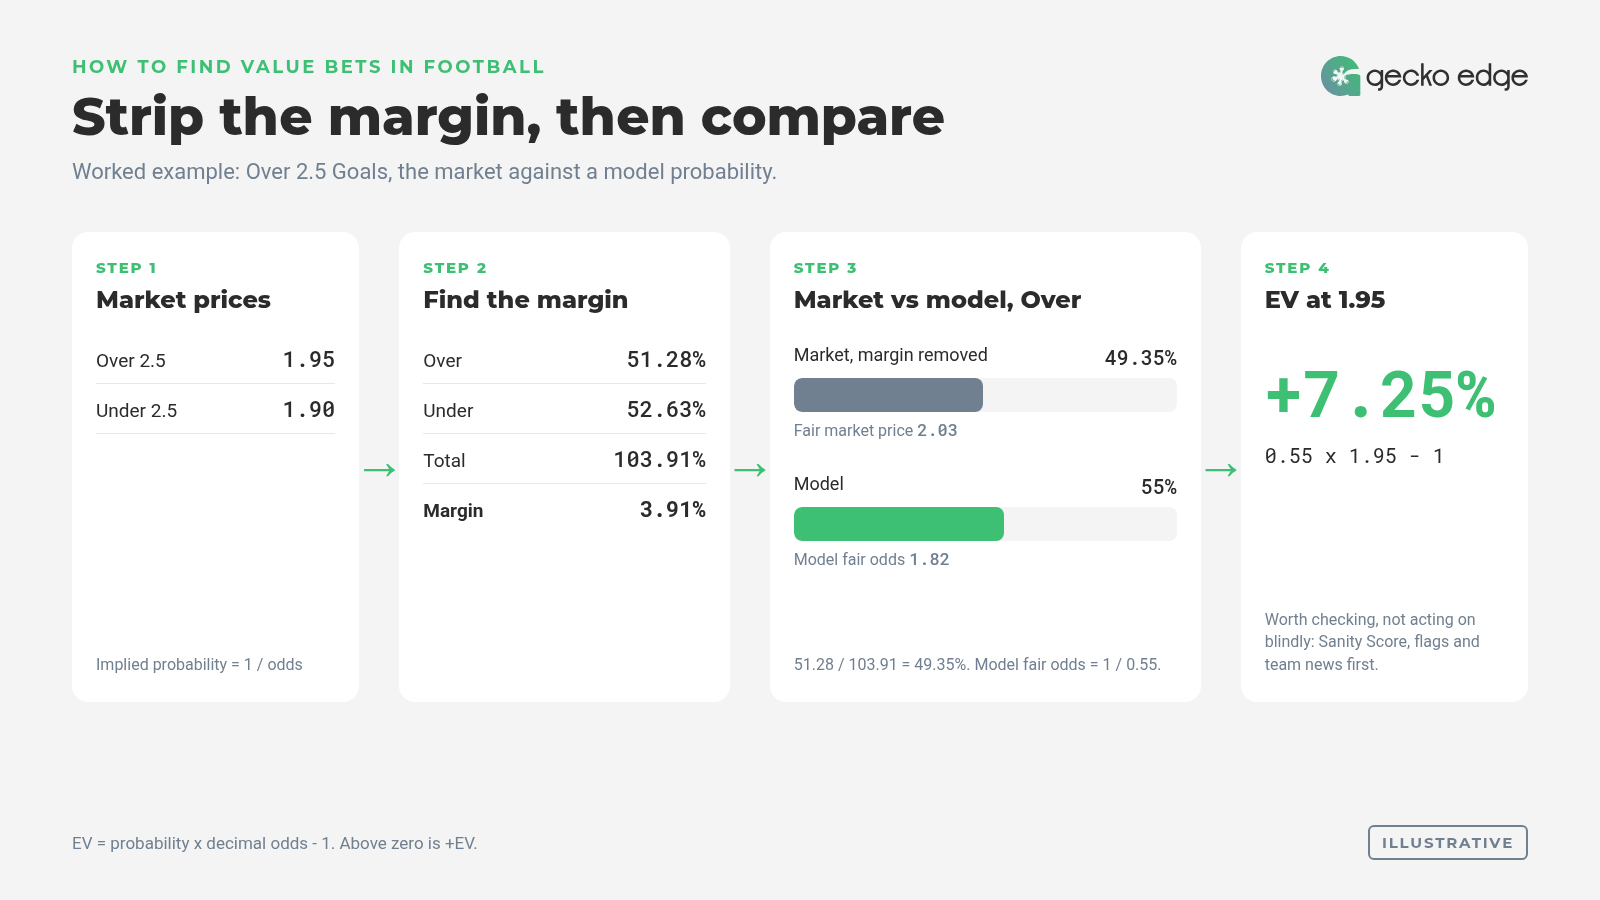
The market. Over 2.5 Goals is priced at 1.95 and Under 2.5 at 1.90.
Implied probabilities.
- Over: 1 / 1.95 = 51.28%
- Under: 1 / 1.90 = 52.63%
- Total: 103.91%, so the margin is 3.91%
No-margin market probability for Over. 51.28 / 103.91 = 49.35%, which is a fair market price of 2.03.
Model probability for Over. 55%, so the model’s fair odds are 1 / 0.55 = 1.82.
EV at 1.95. 0.55 x 1.95 – 1 = +7.25%.
With the margin removed, the market says 49.35%. The model says 55%. At 1.95, that gap is worth +7.25% EV.
A gap that size is worth checking, not acting on blindly. Look at the Sanity Score and flags, and at whether team news has landed. If the model and the market disagree by almost six percentage points, one of them knows something the other does not. Your job at Step 6 is to work out which.
Note what each number does. The market’s no-margin price of 2.03 tells you where the market stands. The model’s fair odds of 1.82 tell you the minimum price worth taking on the model’s view. The quoted 1.95 sits between them: below the market’s own fair price, but above the model’s. That is where the +EV figure comes from.
Model vs market: where value tends to show up and where it does not
Each check in the process answers a different question. Here is what each one tells you and where it appears in Gecko Edge:
| Check | Question it answers | Where it appears in Gecko Edge |
|---|---|---|
| Model probability | How likely is the outcome? | Market tables in a fixture analysis |
| Fair odds | What is the minimum price worth taking? | Market tables |
| EV% | How far is the price above fair? | Market tables, league scan |
| Sanity Score (0-10) | How strongly does the modelling agree, with fresh odds? | Sanity table |
| Flags | Is anything unusual (e.g. divergence)? | Flags section |
| Odds taken | What did you actually get? | +EV Bet Tracker |
A positive EV on its own answers only one of those questions. The model probability, fair odds and EV describe the gap. The Sanity Score and flags describe how much to trust it. The odds you took describe what you actually got. You need all of them to judge a bet properly.
To see the full set on a real match, open a fixture analysis. The Recommendation in the output is not an instruction to bet; you decide whether to act and at what stake.
Two limits are worth stating plainly. First, value can disappear as prices move: a +EV line in the morning may be -EV by kick-off. Second, bookmakers may restrict accounts that consistently take value. Neither changes the maths, but both affect how you apply it.
If you are finding fewer opportunities than you expected, that is normal for a selective process. Our article I’m not finding many opportunities: is value betting right for me? looks at that question.
How to tell if your process is working
Profit alone takes hundreds of bets to mean much; closing line value gives an earlier signal. See closing line value (CLV) explained for football bettors.
FAQ
What is a value bet?
A bet where the odds are higher than the true probability of the outcome justifies, so the expected return is positive over many similar bets.
How do I calculate if a bet is value?
Multiply your probability by the decimal odds and subtract 1. Above zero is +EV.
Do I need a model to find value?
You need a probability you trust. A model gives a consistent one; gut feel rarely does.
What is a good edge to look for?
Gecko Edge’s knowledge base suggests Sanity 7+ alongside +EV 5%+ as a starting filter; the right threshold depends on the market and the odds. See What is a good EV % in betting?
Can a value bet lose?
Yes, often. Value is about price over many bets; any single result carries variance.
How many bets before I know it works?
Hundreds at least. Profit alone is noisy; closing line value gives an earlier signal. See Closing line value (CLV) explained for football bettors.
18+ only. Gecko Edge provides football analytics data for information and entertainment. It does not place bets and no outcome is certain. Bet responsibly, only with money you can afford to lose, and set limits before you start. Free, confidential support: GamCare (https://www.gamcare.org.uk).
Betting responsibly: limits, discipline and where to get support
Try Gecko Edge for free. No card needed.
Last reviewed: 31 October 2026