


The Scoreline is a Liar
xG; in football, the only number that technically matters is the final score. It dictates points, trophies, and relegation. But for those of us looking for betting value picks, the scoreline is often the most deceptive piece of data available.
A 1-0 win might suggest a tight, defensive masterclass. In reality, it could have been a chaotic affair where the winning side conceded four high-quality chances and scored a lucky deflection. The market, driven by the casual punter’s recency bias, tends to price the next match based on that 1-0 result. They see a “solid” defence. We see a ticking time bomb.
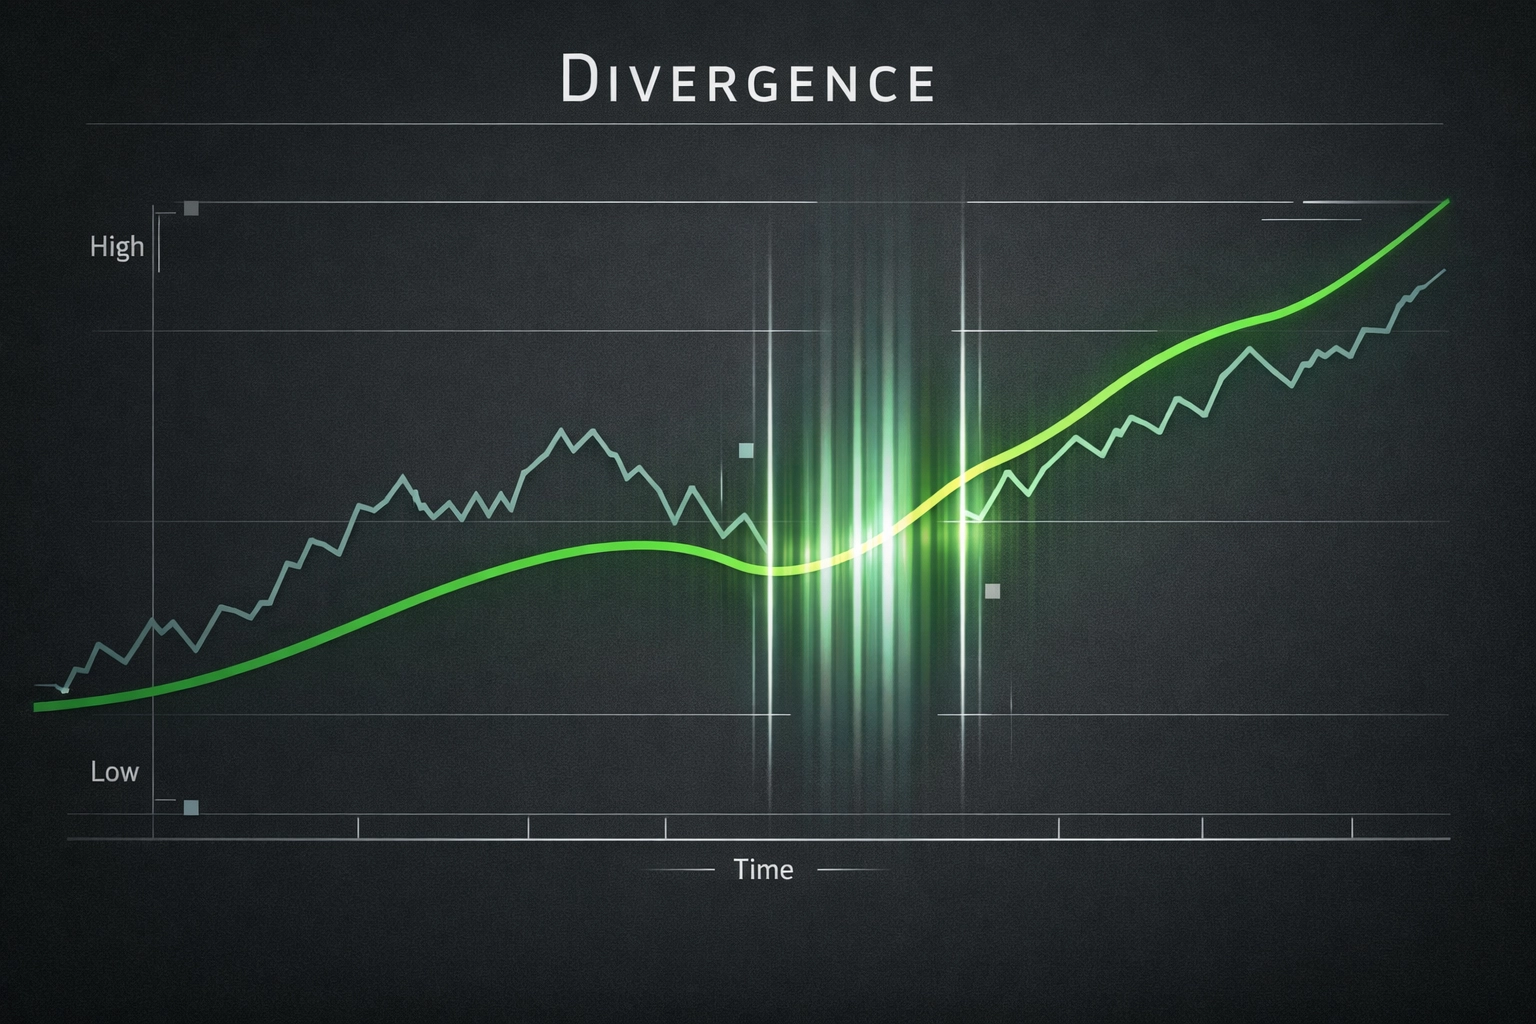
This discrepancy is what we call the xG Gap. It is the distance between what happened and what was statistically likely to happen based on the quality of chances created. If you want to move beyond basic tipping and start thinking like a professional trader, you need to stop watching the ball and start watching the space.
Gecko Edge has tracked 8,439 AI-generated bets and recorded +398pts of profit across 66 competitions. See how the model works →
Understanding the xG Football Analysis Framework
Expected Goals (xG) isn’t just a buzzword for analysts on television. It is a measurement of probability. Every shot is assigned a value between 0 and 1, representing the likelihood of that shot becoming a goal. A penalty is roughly 0.76 xG. A speculative 30-yard strike might be 0.02 xG.
When we aggregate these numbers over ninety minutes, we get a clearer picture of dominance. Gecko Edge uses these metrics to strip away the noise of luck. If a team consistently generates 2.5 xG per match but only scores 0.8 goals, the “Gap” is widening.
The market looks at the 0.8 and assumes the strikers are poor. We look at the 2.5 and realise that, eventually, the maths will catch up. This is the foundation of xG football analysis. It is about identifying teams that are performing well but being rewarded poorly: or teams that are winning matches they have no right to win.
Why the Market Misses the Mark
Betting markets are shaped by information, but they are also shaped by emotion. The “public” loves a winner. When a team wins three games in a row, their price for the fourth game naturally shortens. However, if those three wins were built on unsustainable “worldie” goals and incredible goalkeeping displays (overperforming xG), that team is actually overvalued.
Bookmakers are forced to adjust their lines to balance the books against public opinion. This creates an opening. By using the tools at Gecko Edge, you can spot when a price is based on “form” rather than fundamental performance.
Finding betting value picks is essentially a hunt for regression. We are looking for the moment when a team’s luck runs out or when their hard work finally pays off. The “Gap” represents a market inefficiency that hasn’t yet corrected itself.
The Mathematics of Regression to the Mean
In probability, regression to the mean is the idea that if a variable is extreme on its first measurement, it will tend to be closer to the average on its second.
In football terms:
- The Overperformers: A striker hitting the top corner from outside the box every week is an outlier. Eventually, they will start missing those shots. Their actual goals will regress down to their xG.
- The Underperformers: A team hitting the post and facing “Man of the Match” goalkeeping performances every week will eventually see the net bulge. Their actual goals will regress up to their xG.
The sharpest bettors don’t bet on what happened last week. They bet on the regression. If you’re looking to sharpen your strategy, our knowledge base goes deeper into how these statistical trends manifest over a long season.
How to Identify the Value Gap
To find value, you need a systematic approach. You can’t just look at one game; you need a sample size. Usually, four to six matches provide enough data to see a trend.
Ask yourself these three questions:
- Is the shot volume high, but the conversion low? This suggests a team that is creating chances but getting unlucky. This is a “Buy” signal.
- Is the team conceding a lot of “Big Chances” but keeping clean sheets? This suggests an overworked goalkeeper who is eventually going to let one in. This is a “Sell” signal.
- How does the xG look in different game states? Some teams only create chances when they are losing. Gecko Edge filters this data to show you how a team performs when the game is level: which is where the real value often hides.
By comparing these findings to the current market odds, you can see if the bookies have priced the “unlucky” team too high. If the xG suggests a 50% win probability but the odds suggest 40%, you’ve found your edge.
The Nuance: When xG Lies
Data is powerful, but it isn’t sentient. There are times when the xG Gap exists for a reason, and part of being a professional is knowing when to stay away.
For instance, a team might have a low xG because their tactical instruction is to sit deep and only counter-attack when absolutely necessary. Their xG per shot might be high, even if their total xG is low. Conversely, a team might have a high xG because they take fifty low-quality shots from distance.
This is why we focus on “Non-Penalty xG” and “Big Chances Created.” It separates the “shot-spammers” from the genuine goal-threats. At Gecko Edge, our AI models are trained to distinguish between “empty” stats and meaningful pressure. We compare AI football predictions vs traditional tips to ensure our users aren’t just following a spreadsheet, but a sophisticated model of the game.

Implementing the Strategy
If you want to start using the xG Gap in your own trading, start small. Focus on one league. Learn the rhythm of the teams.
- Track the Delta: Keep a spreadsheet or use the Gecko Edge dashboard to track the difference between goals scored and xG over a rolling 5-game period.
- Identify the Outliers: Look for teams at the extreme ends of the spectrum.
- Check the News: Ensure the gap isn’t caused by a major injury. If the star striker who generates all the xG is out, the regression won’t happen.
- Compare to Market: Use our blog resources to understand how to read market movements against your data.
Betting on the gap requires patience. A team can be “unlucky” for three weeks straight before the floodgates open. But over a season, the maths is undefeated.
Smarter Betting Starts with the Right Data
The difference between a gambler and a bettor is the process. A gambler bets on a feeling or a scoreline. A bettor bets on a model and a margin.
The xG Gap is one of the most consistent ways to find that margin. It allows you to see the match that should have happened, giving you a preview of the match that will happen next. In a world of noise and hype, the data provides a quiet, confident path to profit.
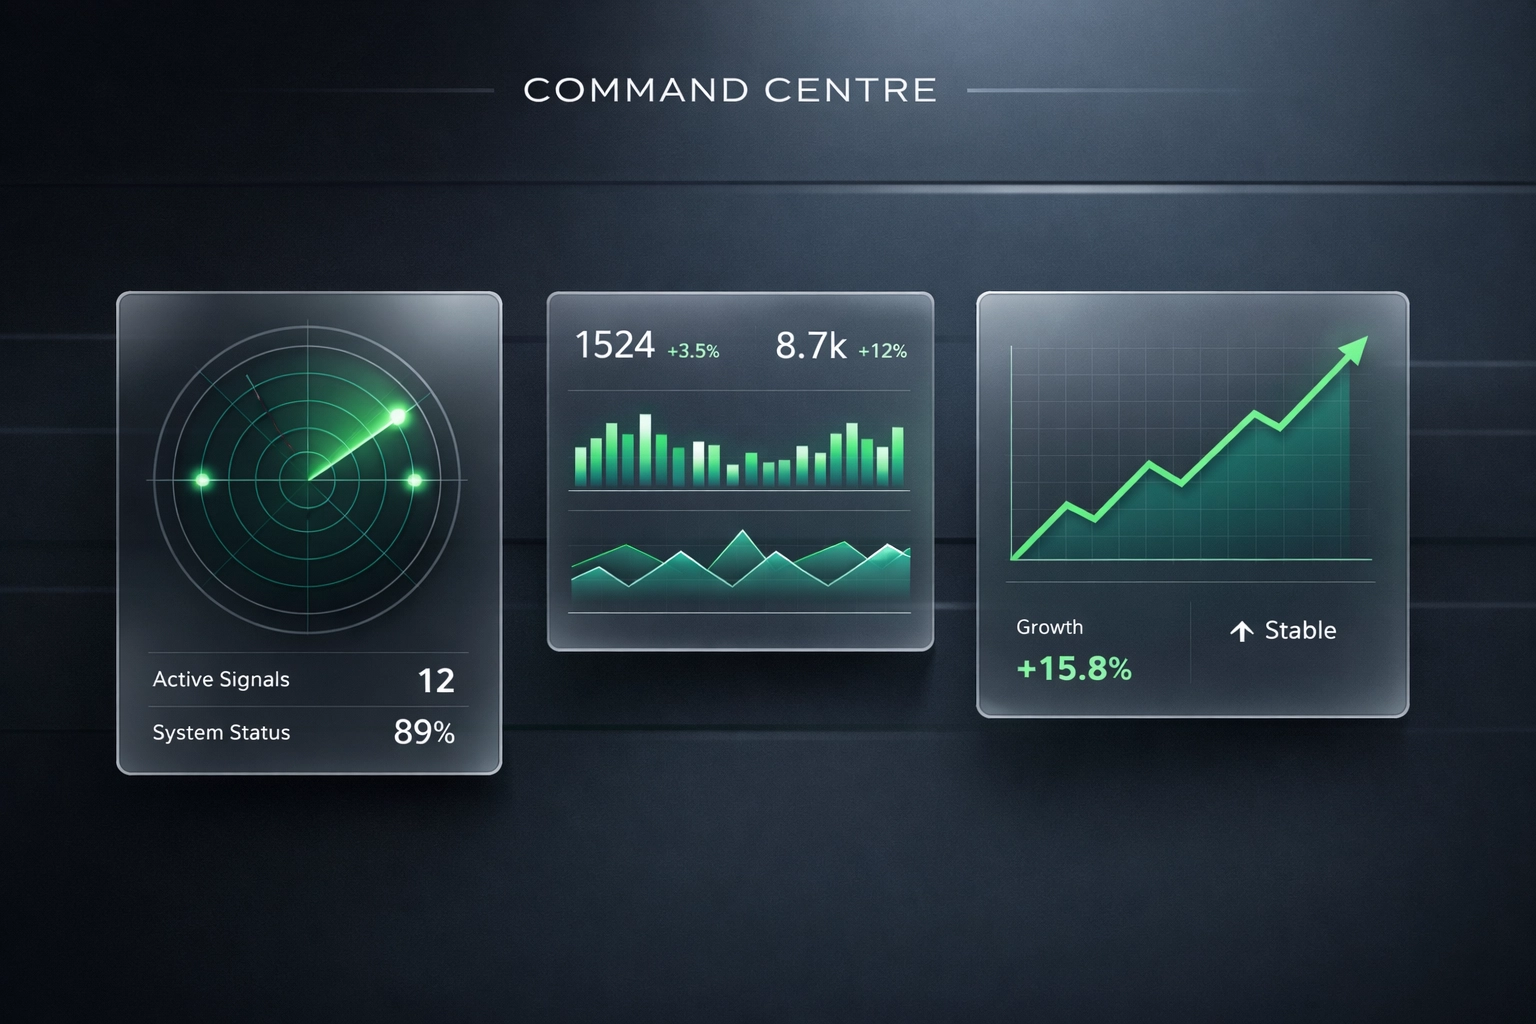
At Gecko Edge, we’ve built the tools to help you identify these discrepancies in seconds, not hours. Whether you are looking for football analysis or trying to understand the deeper mechanics of the market, the goal remains the same: find the value before the rest of the world catches on.
Summary: Ask, Analyse, Act
The process is simple, but the execution requires discipline.
- Ask: Is the scoreline reflecting the reality of the chances?
- Analyse: What does the xG data say about the underlying performance?
- Act: Place the bet where the market has overreacted to the surface-level result.
The gap is where the profit lives. While the rest of the market is chasing yesterday’s goals, we’re busy predicting tomorrow’s. That is the Gecko Edge. Built for bettors, powered by AI.