


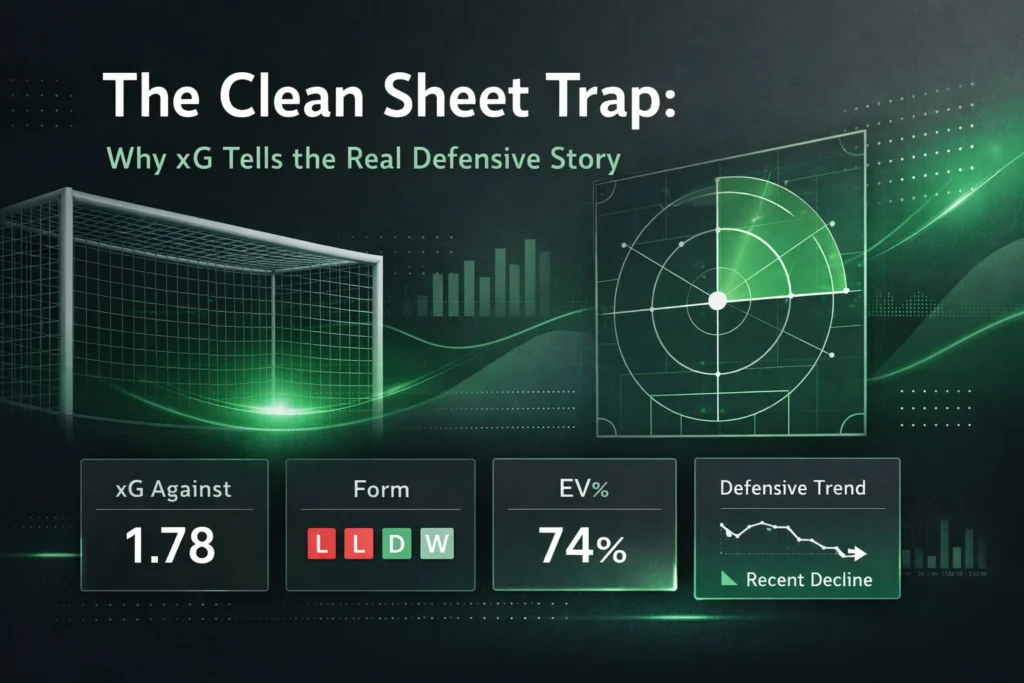
xG; you’re scrolling through the stats. One team’s caught your eye: they’ve kept eight clean sheets in their last twelve matches. Impressive, right? The bookies certainly think so. Their defensive markets are priced tight and their match odds suggest they’re solid at the back.
But here’s what the numbers don’t always tell you: that same team has conceded an expected goals against (xGA) of 1.8 per match during that run. They should have shipped roughly 22 goals. They’ve actually conceded five.
That’s not defensive brilliance. That’s borrowed time.
The Clean Sheet Illusion
Clean sheets are seductive. They’re absolute, binary outcomes: either you concede or you don’t. They feel definitive. But football doesn’t work in absolutes. It works in probabilities, chances, and fine margins.
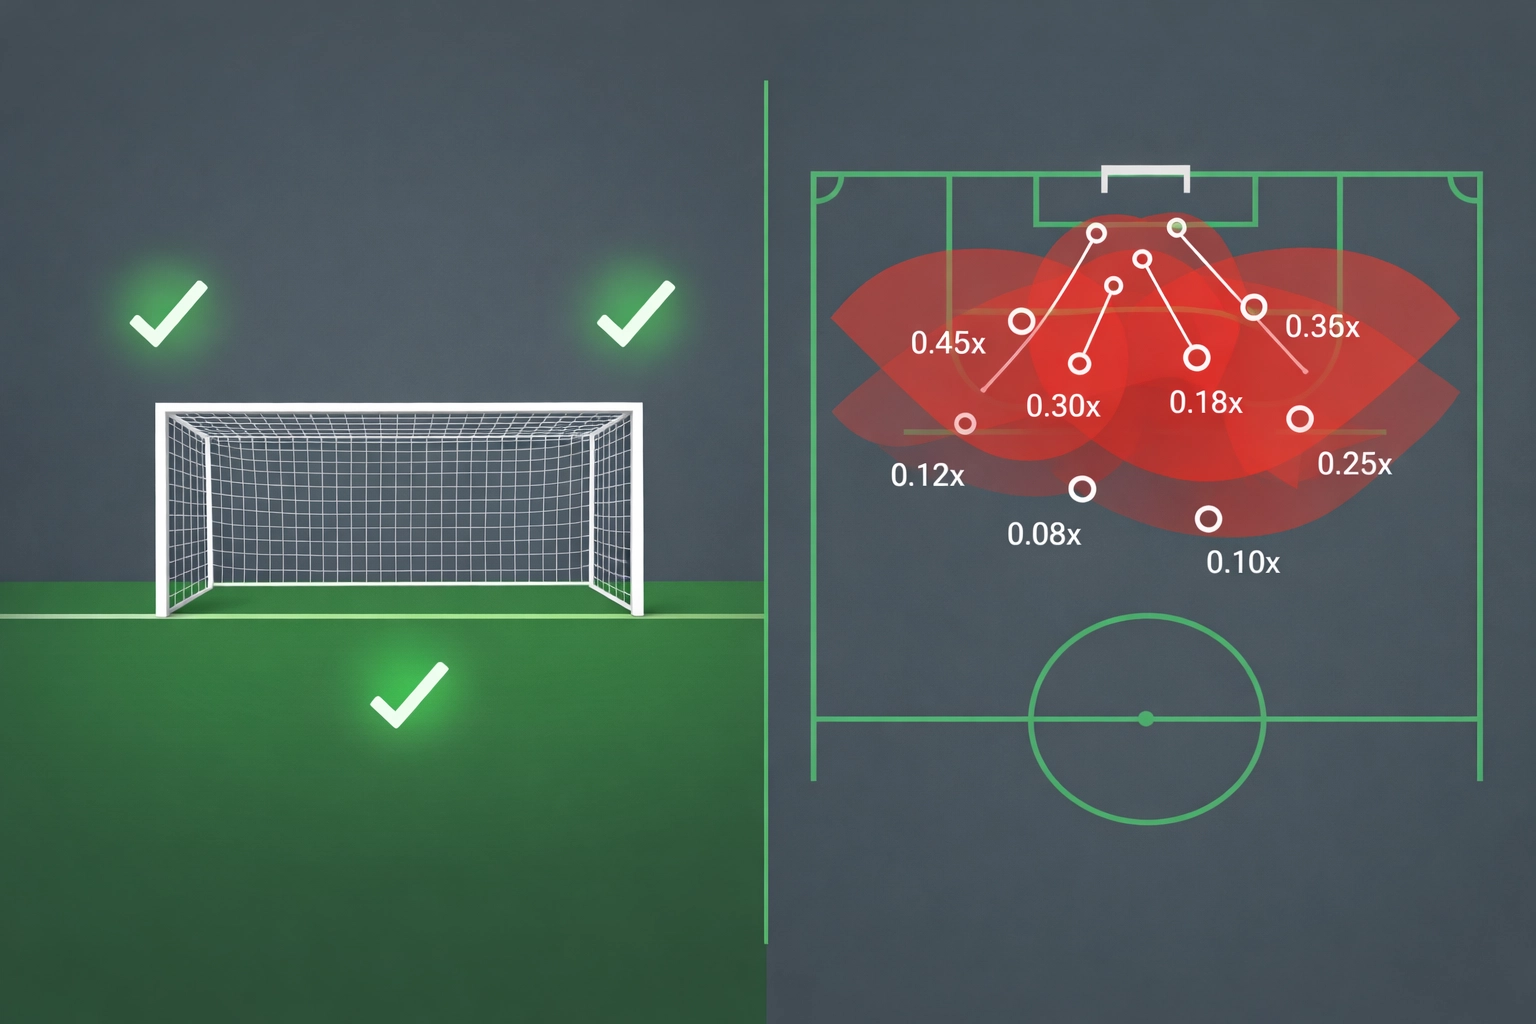
A team can keep a clean sheet while their goalkeeper makes six saves from inside the box. They can hold a 0-0 while allowing fifteen shots, three hitting the woodwork. The scoreline says “solid defence.” The underlying data says “hanging by a thread.”
This disconnect is where value hides: and where casual bettors get burned.
Gecko Edge tracks this gap religiously. Our AI doesn’t just count clean sheets. It measures the quality and volume of chances a defence allows. Expected goals against reveals the truth beneath the surface. And when the two diverge sharply, regression isn’t a possibility: it’s a probability.

What xGA Actually Measures
Expected goals against quantifies how many goals a team should have conceded based on the quality and location of shots they’ve faced. It strips away luck, exceptional goalkeeping, and poor finishing from opponents.
Every shot carries an xG value. A penalty has an xG of roughly 0.76. A shot from 25 yards with three defenders in the way might be 0.03. A one-on-one from the penalty spot could be 0.65. Add them all up over a match, and you’ve got the opponent’s xG: your xGA.
If your goalkeeper faces chances worth 2.1 xG and you concede once, you’ve been fortunate. If that pattern repeats over ten matches: xGA of 21, actual goals of 7: you’re living on the edge. The probabilities will even out. They always do.
Traditional stats miss this entirely. Clean sheets, goals conceded, and shots faced don’t account for chance quality. A team might face twenty speculative efforts from distance and one clear chance. The shot count says “under pressure.” The xGA says “comfortable evening.”
The Anatomy of a False Defence
Let’s walk through a real pattern. A mid-table Championship side keeps four consecutive clean sheets. Their odds tighten. Suddenly they’re favourites against teams they’d normally be level with. The market’s reacting to results, not performance.
But the xG model tells a different story. Across those four matches, they’ve allowed:
- Match one: 1.9 xGA (thirteen shots, four clear-cut chances)
- Match two: 1.6 xGA (nine shots, two one-on-ones saved)
- Match three: 2.2 xGA (opponent hit post twice, keeper world-class)
- Match four: 1.4 xGA (solid but fortunate on a penalty decision)
Total xGA: 7.1. Actual goals conceded: zero.
That’s not a defensive unit clicking into form. That’s variance in their favour. And Gecko Edge flags it immediately. The AI isn’t impressed by clean sheets when the underlying metrics scream overperformance.
Why AI Spots Regression Before You Do
Human brains love patterns. We see four clean sheets and construct a narrative: new formation, defensive coach, players finally gelling. The story makes sense. It feels coherent.
But xG models don’t build narratives. They measure shot quality, location, game state, defensive pressure, and convert it into cold probability. When actual results deviate significantly from expected results over a meaningful sample, the model doesn’t look for explanations. It flags regression risk.
This is where Gecko Edge separates signal from noise. Our AI processes thousands of matches, tracking xGA patterns across leagues and comparing them to actual defensive records. When teams outperform their xGA by 40% or more over eight to ten matches, the system highlights them.
Not because they’re definitely going to collapse. But because the odds don’t reflect the risk. And that’s where edges emerge.

The Flip Side: Genuinely Solid Defences
Of course, not every clean sheet is smoke and mirrors. Some teams genuinely suffocate opponents. Their xGA matches: or even underperforms: their clean sheet record.
You’ll see this with elite defensive units. Liverpool under Klopp at their peak. Atletico Madrid under Simeone. Teams where the xGA sits at 0.8 per match while conceding 0.6 per match. That’s sustainable. That’s structural.
The metrics align. They’re not riding luck: they’re limiting quality chances at source. They compress space, force opponents wide, block passing lanes, and when chances do arrive, they’re low-percentage efforts.
For these teams, clean sheets and xGA tell the same story. The market prices them accordingly. There’s no hidden edge because there’s no disconnect between performance and results.
Your job as a bettor is distinguishing between the two categories. Gecko Edge does this automatically. The AI compares xGA to actual goals conceded over rolling ten-match windows, identifying both overperformers (regression candidates) and underperformers (value targets when opponents fail to convert).
Practical Betting Implications
So what does this mean when you’re placing bets?
First, question clean sheet runs. Don’t dismiss them, but don’t accept them at face value. Check the xGA. If a team’s conceded eight goals but faced 18 xGA over twelve matches, their defensive record is fragile. The market might not have adjusted yet.
Second, target both sides of the disconnect. Teams significantly outperforming xGA are regression candidates: consider opposing them or backing their opponents. Teams underperforming xGA might be value when the odds suggest they’re defensively weak.
Third, watch for goalkeeper overperformance. When a keeper consistently saves shots he statistically shouldn’t, it’s heroic: and unsustainable. Post-shot xG (which measures shot-stopping ability) can isolate this effect. If a defence looks shaky in xGA but the keeper’s bailing them out, that’s a bet against waiting to happen.
Finally, combine xGA with fixture analysis. A team with a fortunate clean sheet run facing three top attacking sides might see their luck evaporate fast. Gecko Edge layers fixture difficulty into the model, spotting these collision points before the market reacts.

When the Trap Snaps Shut
Regression doesn’t arrive on schedule. A team can outperform xGA for fifteen matches before the probabilities reassert themselves. But when it happens, it tends to happen fast.
One match, they concede twice from three chances. Next match, another two from four chances. Suddenly the clean sheet run is a memory, and the market’s overcorrecting in the opposite direction.
This is where disciplined bettors profit. Not by predicting the exact match where regression strikes, but by understanding that overpriced “solid defences” built on high xGA are systematically poor value. Over time, backing or opposing these teams profitably isn’t luck: it’s mathematics.
The clean sheet trap isn’t about dismissing defensive performances. It’s about understanding what’s real and what’s borrowed time. Expected goals against tells you which is which. And in a market that still prices heavily on results rather than process, that knowledge is an edge.
Gecko Edge tracks it all. The clean sheets, the xGA, the shot quality, the goalkeeper performance. Because in football, what looks solid isn’t always strong. And knowing the difference is everything.