The short answer
A Poisson model treats each team’s goals as independent counts and turns two expected-goal rates into a probability for every scoreline. Dixon-Coles keeps that grid but adjusts the four low scores, 0-0, 1-0, 0-1 and 1-1, with one parameter, rho. That mainly shifts draw, Both Teams To Score and correct-score probabilities.
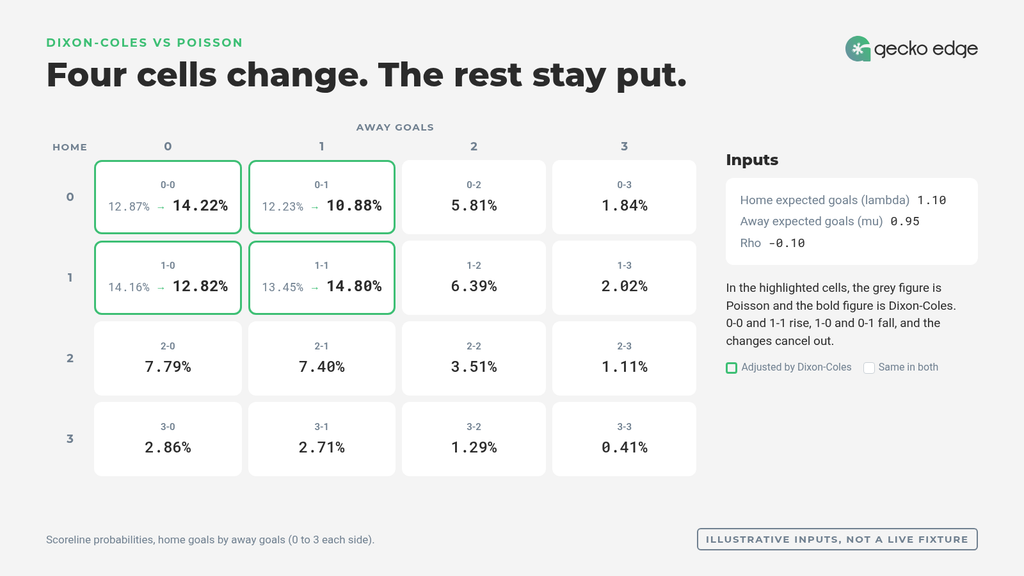
If you are building a football goals model in Excel or Python, you will meet both of these quickly. This guide shows what the Dixon-Coles correction actually does, runs one fixture through both models with every input shown, and sets out which markets move and which stay exactly the same. You can check every figure yourself in our free Poisson calculator.
The Poisson model in one paragraph
A Poisson model starts with one number per team: the expected number of goals it will score in the match, usually written lambda. The Poisson distribution then turns that rate into a probability for each goal count, using P(k) = lambda^k x e^-lambda / k!, where k is the number of goals. Do this for the home side and the away side, multiply the two probabilities together for each combination, and you get a scoreline grid: a probability for 0-0, 1-0, 0-1, 1-1, 2-1 and so on. Add up the right cells and you have a probability for any goals-based market, from the match result to Both Teams To Score to Over/Under 2.5. For a fuller introduction, see our guide to the Poisson model in football betting.
The problem Poisson has with low scores
The step where you multiply the home and away probabilities together carries an assumption: that the two teams’ goal counts are independent. In other words, how many goals the home side scores tells you nothing about how many the away side scores.
Gecko Edge has tracked 8,439 AI-generated bets and recorded +398pts of profit across 66 competitions. See how the model works →
In real football, that is not quite true, especially at low scores. Game state matters. A team leading 1-0 may sit deeper, and a team level at 0-0 late on may settle for the point. Those patterns cluster around the low, tight scorelines. The independent Poisson model tends to slightly undercount draws such as 0-0 and 1-1, and slightly overcount narrow wins such as 1-0 and 0-1.
This is not a new finding. M. J. Maher’s 1982 paper in Statistica Neerlandica found that an independent Poisson model gave a reasonably accurate description of football scores, with some small systematic differences, and that a bivariate Poisson model with a correlation between the scores improved the fit. The bivariate Poisson distribution is one way to handle dependence across the whole grid. Dixon and Coles took a more targeted route.
What Dixon-Coles changes
In 1997, Mark Dixon and Stuart Coles of Lancaster University published “Modelling Association Football Scores and Inefficiencies in the Football Betting Market” in the Journal of the Royal Statistical Society Series C (Applied Statistics). Their model built on Poisson regression with attack and defence strengths for each team and home advantage, and it added two ideas that are still widely used: a correction for low-scoring results, and weighting recent matches more heavily than older ones. This article focuses on the first.
The four adjusted scorelines and the tau factors
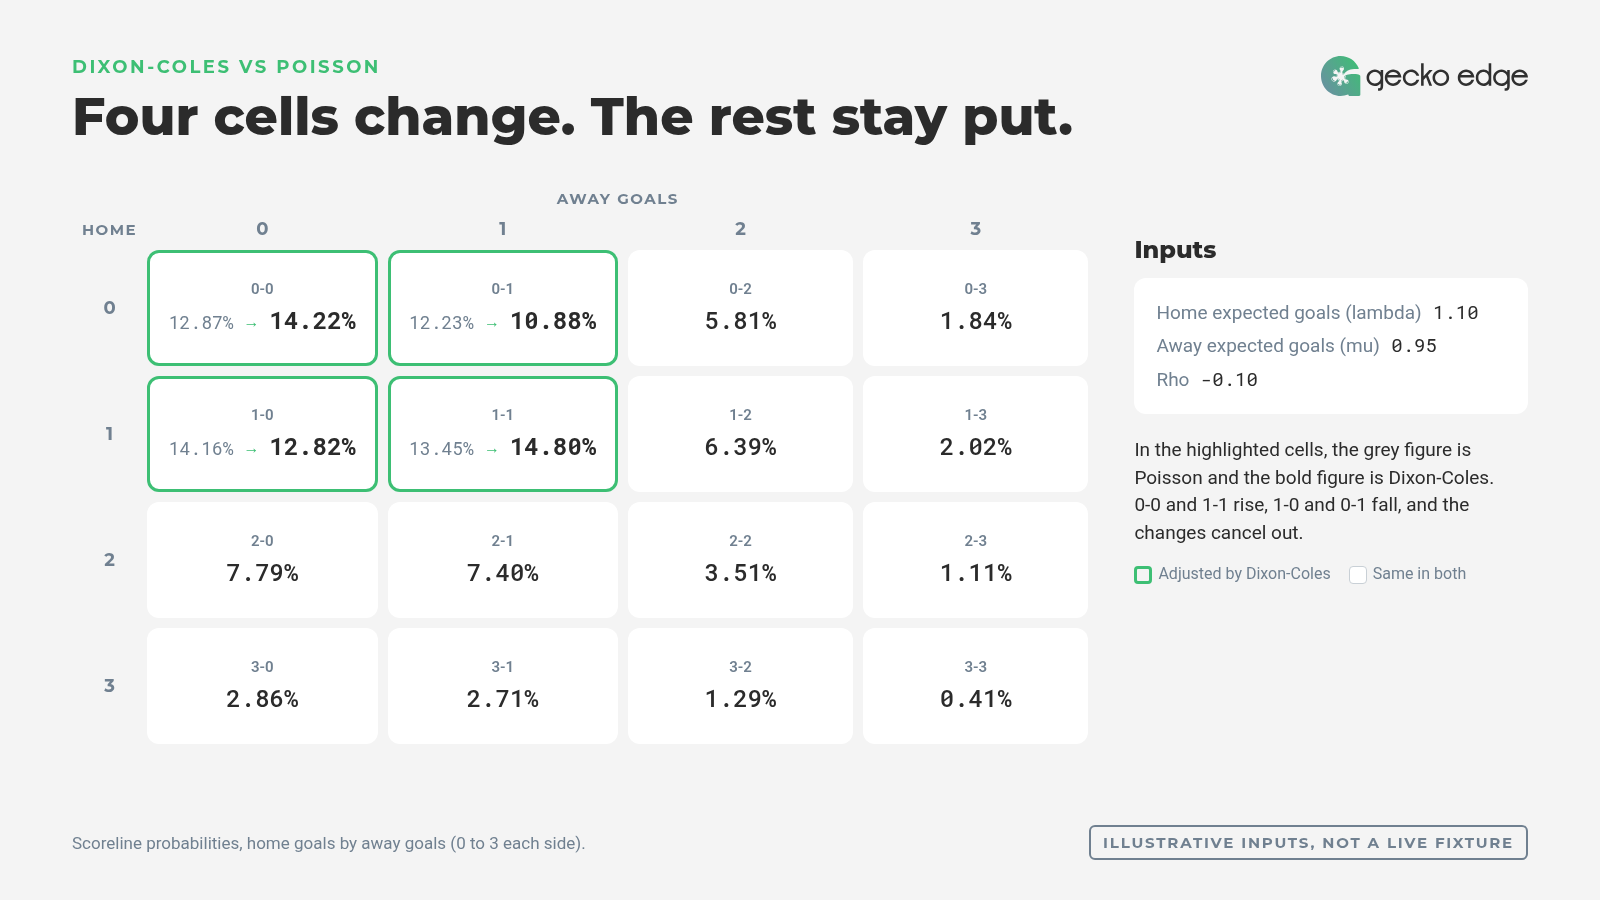
Dixon-Coles leaves every scoreline alone except four: 0-0, 1-0, 0-1 and 1-1. Each of those four cells is multiplied by an adjustment factor, usually written tau. With home expected goals lambda, away expected goals mu and the dependence parameter rho, the factors are:
- 0-0: 1 – (lambda x mu x rho)
- 0-1: 1 + (lambda x rho)
- 1-0: 1 + (mu x rho)
- 1-1: 1 – rho
Every other cell keeps a factor of 1, so it is identical to plain Poisson.
What rho does
Rho controls the size and direction of the correction. When rho is zero, every factor equals 1 and Dixon-Coles is exactly the same as Poisson. When rho is negative:
- the 0-0 and 1-1 factors rise above 1, so those scorelines become more likely;
- the 1-0 and 0-1 factors fall below 1, so those scorelines become less likely.
In plain terms, a negative rho says low-scoring games finish level a little more often than independence suggests. A positive rho would push the other way.
Worked example: one fixture, both models
The inputs below are illustrative, not a live fixture and not a Gecko Edge parameter:
- Home expected goals (lambda): 1.10
- Away expected goals (mu): 0.95
- Rho: -0.10
Plugging these into the tau formulas gives:
- 0-0: 1 – (1.10 x 0.95 x -0.10) = 1.1045
- 0-1: 1 + (1.10 x -0.10) = 0.8900
- 1-0: 1 + (0.95 x -0.10) = 0.9050
- 1-1: 1 – (-0.10) = 1.1000
To see where the Poisson figures come from, take 0-0. The chance the home side scores none is e^-1.10, and the chance the away side scores none is e^-0.95. Multiply them and you get e^-2.05, or 12.87%. Dixon-Coles then multiplies that by 1.1045, giving 14.22%.
Table A: the four adjusted scorelines
| Scoreline | Poisson | Dixon-Coles |
|---|---|---|
| 0-0 | 12.87% | 14.22% |
| 1-0 | 14.16% | 12.82% |
| 0-1 | 12.23% | 10.88% |
| 1-1 | 13.45% | 14.80% |
Add the changes up and they come to zero, allowing for rounding. 0-0 gains 1.35 points and 1-1 gains 1.35 points. 1-0 loses 1.34 points and 0-1 loses 1.35 points. The correction moves probability between the four cells without creating or removing any, so the full grid still adds up to 100%.
Now sum the grid into markets. Fair odds are simply 1 divided by the probability.
Table B: market probabilities and fair odds
| Market | Poisson | Fair odds | Dixon-Coles | Fair odds |
|---|---|---|---|---|
| Home win | 38.75% | 2.58 | 37.40% | 2.67 |
| Draw | 30.28% | 3.30 | 32.97% | 3.03 |
| Away win | 30.98% | 3.23 | 29.63% | 3.37 |
| BTTS Yes | 40.91% | 2.44 | 42.26% | 2.37 |
| BTTS No | 59.09% | 1.69 | 57.74% | 1.73 |
| Under 2.5 | 66.31% | 1.51 | 66.31% | 1.51 |
The draw moves from a fair price of 3.30 to 3.03, which is a meaningful shift for a market where small price gaps matter. Both win prices drift slightly. BTTS Yes shortens. Under 2.5 does not move at all.
Which markets move, and which do not
Table C: what moves
| Market | Moves? | Why |
|---|---|---|
| Draw, match result | Yes | 0-0 and 1-1 gain, 1-0 and 0-1 lose |
| BTTS | Yes | 1-1 gains while 1-0 and 0-1 lose |
| Correct score | Yes | The four cells change directly |
| Under/Over 1.5, Over 0.5 | Yes | 0-0, 1-0 and 0-1 are all under 1.5 |
| Under/Over 2.5 and higher totals | No | All four adjusted cells sit under 2.5, and the adjustments cancel out |
| Asian Handicap, especially 0 and quarter lines around it | Yes | Draw and one-goal margins move |
It is easy to assume that a model which changes low scores must change the 2.5 line. It does not. All four adjusted scorelines have two goals or fewer, so they all sit on the Under 2.5 side. The correction only moves probability between those four cells, so the total under 2.5 is unchanged, and so is every total line from 2.5 upwards. Totals at 1.5 and 0.5 do move, because the line cuts through the four cells.
BTTS moves because only one of the four cells, 1-1, has both teams scoring. When 1-1 gains and 1-0 and 0-1 lose, BTTS Yes rises. If you want to know why Yes and No, or Over and Under, always add up to 100%, our knowledge base explains why Over/Under and BTTS probabilities always sum to 100%, and how the BTTS Yes / No reasoning works.
Asian Handicap lines around zero move too, because they depend on the draw and one-goal margins, which are exactly the results the correction reshapes.
Is Dixon-Coles better than Poisson?
It depends on the data and the markets you care about.
The published case for the correction rests on the original research. Maher (1982) found small systematic differences between observed scores and an independent Poisson model, and a better fit when dependence between the two scores was allowed. Dixon and Coles (1997) fitted their model to English league and cup results from 1992 to 1995 and introduced the low-score adjustment to handle that dependence directly. They also tested a betting strategy based on the model against bookmakers’ odds from the 1995 to 1996 season and reported a positive return. That is a historical test on one set of leagues from the 1990s, and it says nothing about how any model performs in today’s markets.
For draw, BTTS and correct-score markets, the correction targets a known weakness, so it is a sensible default. For Over/Under 2.5 and above, it makes no difference to the probabilities. The only reliable way to choose is to compare both models out of sample on your own data, using the markets you actually analyse.
Where both models fall short
Dixon-Coles fixes one specific issue. It does not fix the inputs, and both models share the same limits:
- Goal-rate inputs. Both models are only as good as the expected-goal rates you feed them. A poor lambda produces a precise-looking but wrong grid.
- Red cards. A sending-off changes the scoring rate mid-match. A pre-match grid cannot see it.
- Game state. Teams change their approach when leading or trailing. Dixon-Coles nods to this at low scores, but not across the whole match.
- Team news. Line-ups, injuries and rotation shift goal rates and need to be reflected in the inputs.
- Promoted sides and early-season data. With little recent data at the right level, team strengths are uncertain, and both models inherit that uncertainty.
How Gecko Edge uses both
Gecko Edge uses both models as steps in one pipeline: Lambda, Poisson grid, Dixon-Coles correction, Bayesian blend, Gecko Edge Secret Sauce, then EV against the live market. Goal rates come first, the Poisson grid turns them into scoreline probabilities, and the Dixon-Coles correction adjusts the low scores before the Bayesian blend combines the evidence. The weights and parameter values stay private. Our plain-English pipeline overview walks through each step, and our article on Bayesian football models covers the next stage in more depth.
The output is a set of measured probabilities, and the gap between those probabilities and the market price. That gap is what explains why a draw or a BTTS price looks long or short on a given fixture. It is a decision tool: whether to act stays with you. You can run a fixture analysis in the app to see the model’s view of a match. For a broader overview of how football models fit together, see our football models explainer.
FAQ
What is the Dixon-Coles model?
A 1997 adjustment to the Poisson football model that corrects the probabilities of 0-0, 1-0, 0-1 and 1-1 using a single dependence parameter, rho.
Is Dixon-Coles better than Poisson?
Often for draws and low scores, but not automatically. Compare both out of sample on your own data.
Does Dixon-Coles change Over/Under 2.5?
No. The four adjusted scorelines all sit under 2.5 and the changes cancel, so 2.5 and higher totals are unchanged.
What does a negative rho mean?
It raises 0-0 and 1-1 and lowers 1-0 and 0-1, so draws become more likely than plain Poisson suggests.
Can I build a Dixon-Coles model in Excel?
Yes for a basic version; fitting rho and time decay is easier in Python or R.
What does Dixon-Coles not fix?
Poor goal-rate inputs, red cards, game state, line-ups and changing team strength.
Does Gecko Edge use Dixon-Coles?
Yes. It is one named step in the pipeline, after the Poisson grid and before the Bayesian blend. Weights and parameter values stay private.
References
- Dixon, M. J. and Coles, S. G. (1997). Modelling Association Football Scores and Inefficiencies in the Football Betting Market. Journal of the Royal Statistical Society Series C (Applied Statistics), 46(2), 265-280. https://doi.org/10.1111/1467-9876.00065
- Maher, M. J. (1982). Modelling association football scores. Statistica Neerlandica, 36(3), 109-118. https://doi.org/10.1111/j.1467-9574.1982.tb00782.x
18+ only. Gecko Edge provides football analytics data for information and entertainment. It does not place bets and no outcome is certain. Bet responsibly, only with money you can afford to lose, and set limits before you start. Free, confidential support: GamCare (https://www.gamcare.org.uk).
Betting responsibly: limits, discipline and where to get support
Try Gecko Edge for free. No card needed.
Last reviewed: 29 October 2026