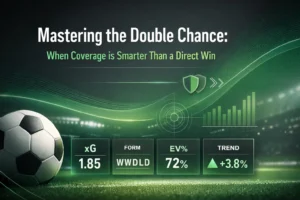
Most football bettors still back teams based on gut feelings and yesterday’s news. Meanwhile, smart money uses xG data to spot value in three minutes flat.
Here’s the truth: Expected Goals (xG) reveals what actually happened on the pitch. Not what the scoreline suggests. Not what the headlines scream. What really happened.
And you can master this in the time it takes to make a cup of tea.
Why xG Trumps Everything Else
Traditional football betting tips focus on results. “Liverpool beat City 3-1, they’re in great form.” But what if Liverpool had 0.8 xG and City had 2.4 xG? Suddenly that 3-1 win looks like lucky finishing and poor defending.
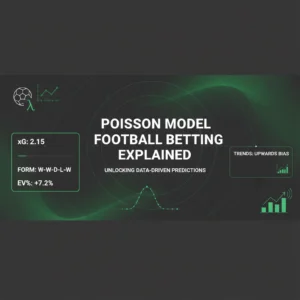
xG measures shot quality. Every shot gets a probability score based on:
- Distance from goal
- Angle of the shot
- Type of assist
- Defensive pressure
- Body part used
A penalty gets 0.76 xG. A speculative effort from 30 yards gets 0.02 xG. Simple.
When bookmakers set odds, they often lag behind recent xG performance. This creates opportunities.
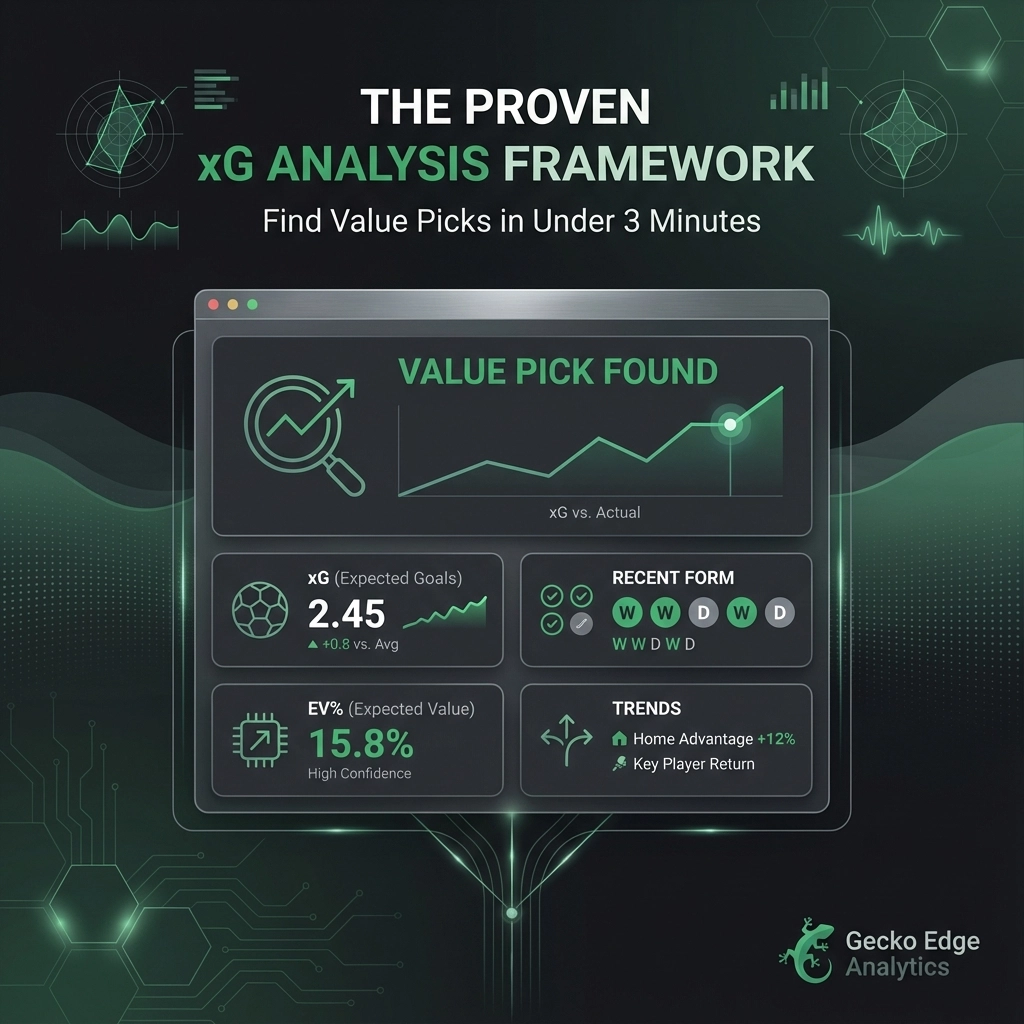
The 3-Minute xG Framework
This framework works for any match, any league, any betting market. You need three data points and ninety seconds of analysis.
Step 1: Check Recent xG Form (60 seconds)
Pull the last five matches for both teams. Ignore the results. Focus on:
- Average xG created per match
- Average xG conceded per match
- xG difference (created minus conceded)
Look for patterns. Is a team consistently creating 2.0+ xG but only scoring once? That’s unsustainable shooting. Regression coming.
Is a team conceding 0.8 xG per match but shipping three goals regularly? Their goalkeeper’s having a nightmare. Won’t last.

Step 2: Calculate Expected Match xG (30 seconds)
Take team A’s average xG created and team B’s average xG conceded. Add them together, divide by two. That’s team A’s expected xG for this match.
Repeat for team B.
Example:
- Arsenal average 1.8 xG created
- Brighton average 1.2 xG conceded
- Arsenal’s expected xG: (1.8 + 1.2) ÷ 2 = 1.5 xG
Quick math. No spreadsheets needed.
Step 3: Compare Against Market Odds (90 seconds)
Convert your expected xG to goal probabilities:
- Under 1.0 xG = Low scoring chance
- 1.0-1.5 xG = Moderate chance
- 1.5+ xG = Strong chance
Now check the bookmaker’s implied probabilities. If your xG analysis suggests a team should score 1.8 goals on average, but they’re priced like they’ll score 1.2, you’ve found value.
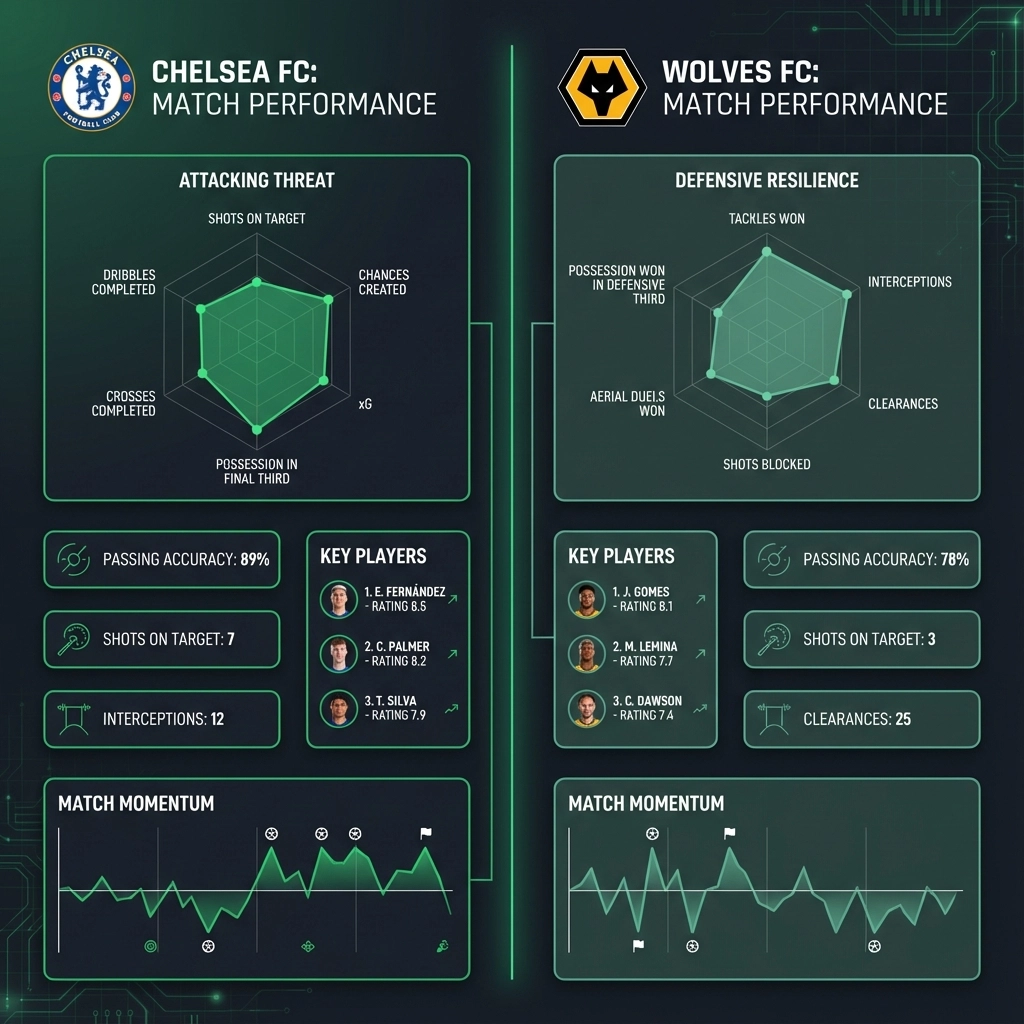
Worked Example: Finding Hidden Value
Let’s say Chelsea face Wolves at Stamford Bridge this weekend.
Step 1 – Recent xG Form:
Chelsea last 5 matches:
- Created: 2.1, 1.8, 2.3, 1.6, 2.0 = Average 1.96 xG
- Conceded: 0.9, 1.4, 0.8, 1.1, 0.7 = Average 0.98 xG
Wolves last 5 matches:
- Created: 1.1, 1.3, 0.9, 1.4, 1.0 = Average 1.14 xG
- Conceded: 1.8, 2.1, 1.6, 1.9, 2.0 = Average 1.88 xG
Step 2 – Expected Match xG:
- Chelsea expected xG: (1.96 + 1.88) ÷ 2 = 1.92 xG
- Wolves expected xG: (1.14 + 0.98) ÷ 2 = 1.06 xG
Step 3 – Market Analysis:
The bookmakers have Chelsea at 1.40 odds (71% probability). But xG suggests Chelsea should dominate. With 1.92 expected xG, they’re likely to score 2+ goals.
Meanwhile, Wolves are outsiders at 8.00 odds (12.5% probability). But 1.06 xG isn’t terrible for an away side. Value might exist on Wolves +1.5 handicap.
The market’s pricing Chelsea’s goal threat correctly but underestimating Wolves’ potential resistance.

How Gecko Edge Accelerates This Process
Doing this manually works. But Gecko Edge makes it effortless.
Our platform delivers instant xG analysis for every match. No spreadsheet juggling. No manual calculations. The AI processes thousands of data points and serves up the value opportunities.
Key features that save time:
- Instant xG metrics for all major leagues
- Predictive modelling that factors in team news, motivation, weather
- AI-powered suggestions that highlight value discrepancies
- Real-time updates as markets move
Instead of three minutes, you get the analysis in thirty seconds. More time to evaluate multiple matches.
Why This Beats Traditional Methods
Old-school tipsters focus on narratives. “United always struggle after European nights.” “Arsenal can’t defend set pieces.” These stories might contain truth, but they’re already priced into the market.
xG cuts through the noise. It shows you:
- Which teams are due for regression
- Which defences are vulnerable despite clean sheets
- Which attacks are clicking but haven’t been rewarded
- Which goalkeepers are saving their teams or costing points
The data doesn’t lie. Form tables do.
Common xG Mistakes to Avoid
Mistake 1: Ignoring Context
A 2.5 xG performance against relegation fodder means less than 1.8 xG against title contenders. Quality of opposition matters.
Mistake 2: Small Sample Sizes
One match of high xG doesn’t indicate form. Look for patterns across multiple games.
Mistake 3: Forgetting Squad Changes
If a team’s star striker is injured, their xG creation will drop. Factor in team news.
Mistake 4: Chasing Yesterday’s Numbers
xG shows what happened, not what will happen. Use it to identify trends, not predict exact scorelines.
The Market Edge
Most recreational bettors don’t use xG data. They back favourites, follow tips, or punt on gut instinct. This creates inefficiencies.
Professional bettors and syndicates use advanced metrics. But they’re not sharing their methods on Twitter or selling tips for a fiver.
You’re now in the middle ground. Armed with xG knowledge but not drowning in complexity.
The framework gives you an edge without requiring a statistics degree. Three minutes of analysis beats three hours of reading match previews.
Start small. Test the method on upcoming fixtures. Track your value picks. See how often the xG analysis correctly identifies mispriced markets.
Within a month, you’ll spot value opportunities that others miss entirely.
The numbers don’t guarantee wins. But they show you where the smart money should go. And in football betting, finding value is everything.
Getting Started Today
Pick three matches from this weekend’s fixtures. Run them through the framework. Compare your xG-based expectations against the bookmaker odds.
Look for:
- Overpriced favourites with poor recent xG
- Underpriced underdogs with solid defensive metrics
- Goal markets that don’t match xG totals
Don’t bet yet. Just observe. See how your analysis compares to what actually happens.
After a few weeks of tracking, you’ll understand which patterns lead to value. Which markets respond best to xG analysis. Which bookmakers are slowest to adjust.
That’s when you start putting money behind the method.
Football’s beautiful game becomes more beautiful when you understand what’s really happening beneath the surface. xG shows you that reality. The framework shows you how to profit from it.
Three minutes. That’s all it takes to think like a professional.