


You’ve probably been there. You check the match stats after a bet goes south, and it shows your team had 18 shots to their opponent’s 7. Yet somehow, you lost 2-0. The commentator talks about how “unlucky” your side was. The shot count looked brilliant on paper, but what about Expected Goals (xG)?
Here’s the thing: shot volume is one of the most misleading statistics in football betting. And if you’re still using it as a primary metric, you’re essentially betting blind.
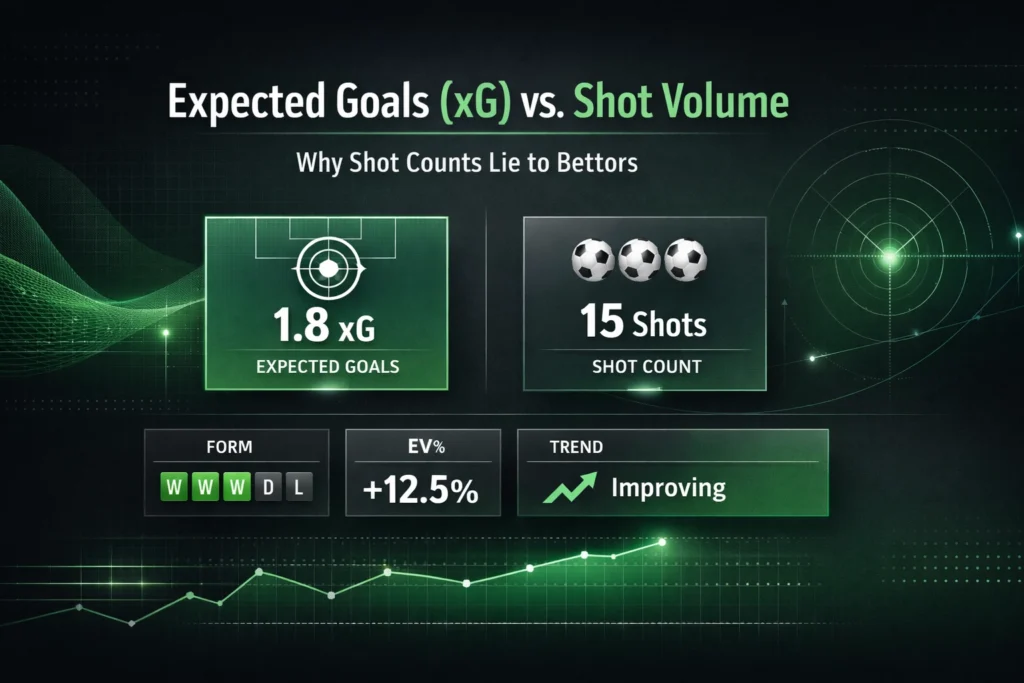
Let’s talk about why shot counts lie, what Expected Goals (xG) actually tells you, and how understanding the difference can transform your betting approach.
Why Shot Counts Are Misleading
Not all shots are created equal. That’s the fundamental truth that shot volume completely ignores.
Imagine two teams both finish a match with 15 shots each. Sounds balanced, right? But what if one team’s shots came from inside the six-yard box after intricate build-up play, while the other team launched hopeful efforts from 30 yards out because they couldn’t break down a compact defence?
The shot count shows equality. The actual quality of those chances? Worlds apart.
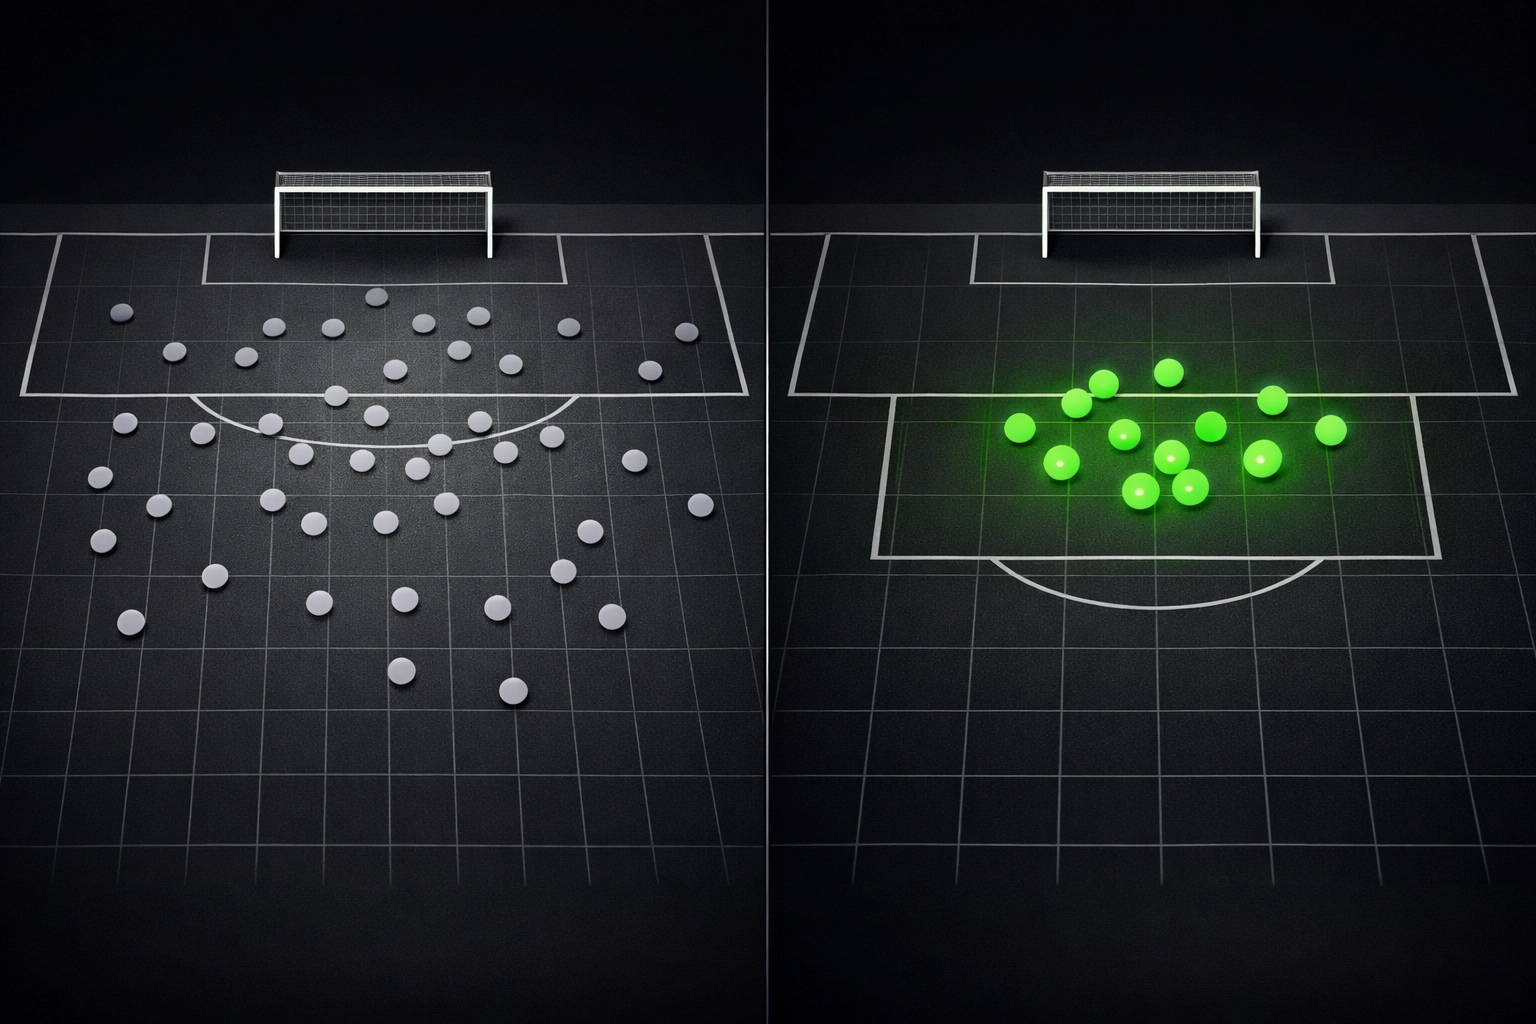
This is where most casual bettors get caught out. They see a team averaging high shot volumes and assume that team is creating chances. Sometimes they are. Often, they’re just taking a lot of terrible shots because they can’t create anything better.
Think about a team facing a low block. They might pepper the goal with 20 attempts, but if 15 of those are speculative long-range efforts that the goalkeeper collects comfortably, that shot volume is essentially meaningless. Meanwhile, their opponent hits them twice on the counter with two clear-cut chances and wins 2-0.
The shot count says one thing. The reality says another.
What Expected Goals (xG) Actually Measures
Expected Goals flips the script entirely. Instead of counting shots, it evaluates the quality of each scoring opportunity.
Every shot gets assigned a probability value based on historical data. A tap-in from two yards out might have an xG value of 0.95, meaning similar chances result in goals 95% of the time. A long-range effort from 35 yards might carry an xG of 0.02.
The calculation considers multiple factors: distance to goal, angle of the shot, body part used, defensive pressure, and even the type of assist that created the chance. A perfectly weighted through ball creates a different quality of chance than a deflected clearance that falls kindly.
This is where things get interesting for bettors. You start seeing beyond the surface-level stats and into the actual quality of a team’s performance.
A team with a low xG per shot reveals they’re taking poor-quality chances. High shot volume but low total xG? That’s a team struggling to create genuine opportunities, regardless of what the shot count suggests.

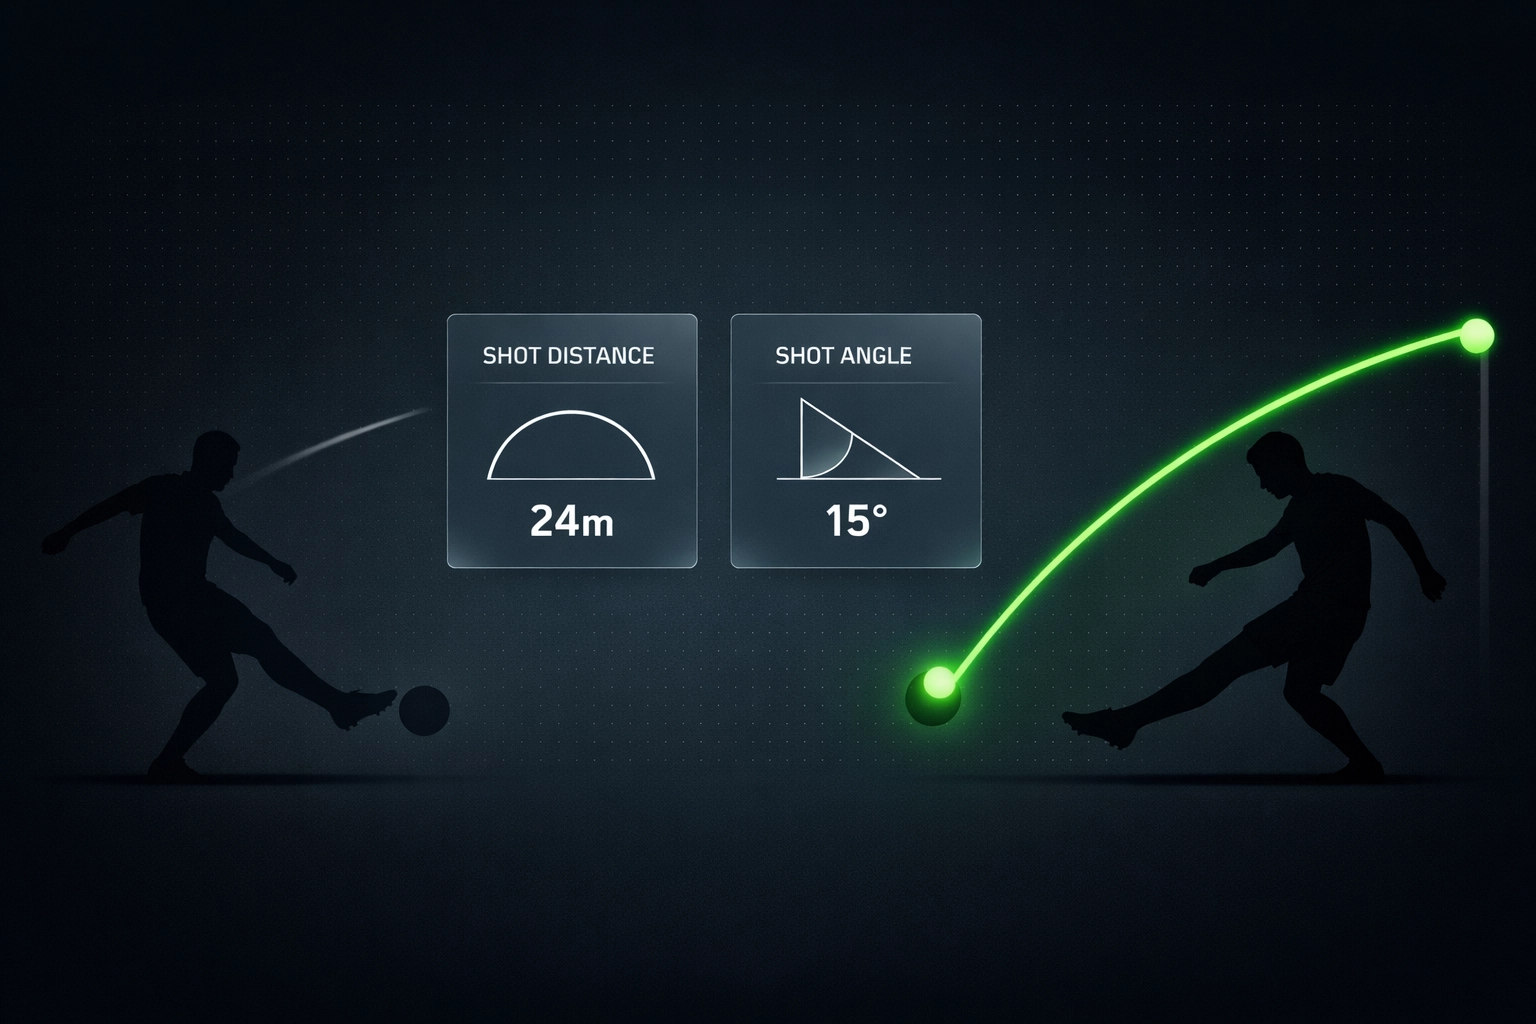
The Distance and Angle Factor
Location matters more than almost anything else in football. Two shots from the same distance can have wildly different xG values based purely on angle.
Take a shot from six yards directly in front of goal. High xG, obviously. Now take a shot from six yards but out near the byline, almost parallel with the goal line. Suddenly, the angle becomes incredibly tight, the goalkeeper has better positioning, and the xG drops significantly.
Distance and angle work together. A shot from 12 yards out at a central angle might have a higher xG than a shot from eight yards at a wide angle. This is the nuance that shot counts completely miss and that xG captures perfectly.
Here’s a real-world example: you’re analysing a striker who’s taken 25 shots in his last five matches. Impressive volume, right? But when you check his xG, it’s sitting at just 1.2 total. That’s 0.048 xG per shot. He’s not getting into dangerous positions. He’s just shooting whenever he gets the ball.
Compare that to a striker with 10 shots and an xG of 3.5. That’s 0.35 per shot. Lower volume, but he’s consistently finding himself in high-percentage scoring positions.
Which striker would you rather back in an anytime goalscorer market?
Using Expected Goals (xG) Difference to Find Value
This is where xG becomes a proper betting tool rather than just an interesting statistic.
xG difference between two teams over multiple matches reveals which side is genuinely creating better football. Not just more football, but better football.
When a team consistently posts positive xG differences but isn’t winning matches yet, they’re likely due for regression to the mean. Their performances are strong, but the results haven’t caught up. That’s value waiting to be found.
The reverse is equally important. A team winning matches but posting negative xG differences is riding their luck. Eventually, performances catch up with results. Those inflated odds on their opponents? Suddenly they make sense.
Look at it over a sample size of at least 10 matches. If Team A has an average xG difference of +0.8 per match but is sitting mid-table, something’s off. Either their finishing is temporarily poor, or their goalkeeper is having a nightmare. Neither situation lasts forever.
Team B might be top of the league with an average xG difference of -0.3 per match. They’re overperforming based on chance quality. The market might love them because of their league position, but the underlying numbers suggest they’re vulnerable.
That’s where smart money finds edges.
How Gecko Edge Makes This Simple
Here’s the problem with manual xG analysis: it’s time-consuming and requires access to reliable data sources. You need to track multiple matches, calculate averages, compare team metrics, and identify meaningful patterns.
That’s exactly what Gecko Edge handles automatically with real-time data and predictive modelling.
Rather than spending hours pulling xG data from multiple sources and building spreadsheets, Gecko Edge processes this information instantly. The AI identifies teams with significant xG overperformance or underperformance, flags matches where the odds don’t align with underlying metrics, and surfaces opportunities that manual analysis would take days to find.
The platform doesn’t just show you Expected Goals numbers. It interprets them in context with form, injuries, tactical setups, and historical patterns. It’s the difference between having data and having insight.
You get clear signals about which teams are creating genuine quality chances versus which ones are just racking up shot volume. You see Expected Goals trends over time, not just single-match snapshots. And you identify value before the market corrects.
Gecko Edge turns complex analytical work into simple, actionable betting intelligence. Built for bettors, powered by AI.
Shot counts will always be part of football coverage because they’re simple and easy to understand. But if you’re serious about betting, you need to go deeper.
xG reveals what shot volume hides. It shows you the truth behind the performances, not just the surface-level statistics.
Start asking better questions. Not “how many shots did they take?” but “what quality of chances did they create?” Not “what’s their shot volume?” but “what’s their Expected Goals per shot?”
The answers will change how you bet.
And when you combine that understanding with AI-powered analysis from Gecko Edge, you’re not just betting smarter. You’re betting with genuine edge.