


Most punters spend hours analysing team news, form guides, and head-to-head records. Meanwhile, the sharpest bettors are finding value in minutes using Expected Goals data.
Here’s the thing about xG analysis: it’s not about being clever or showing off your statistical knowledge. It’s about spotting the obvious disconnect between what actually happened and what should have happened.
And once you know where to look, this process takes less time than making a cup of tea.
Gecko Edge has tracked 8,439 AI-generated bets and recorded +398pts of profit across 66 competitions. See how the model works →
The Foundation: What xG Actually Tells You
Expected Goals measures the quality of scoring chances based on historical data. A shot from six yards has a higher xG value than one from 25 yards. Simple enough.
But here’s where it gets interesting for value hunters: xG reveals which teams are living on borrowed time and which are due a change in fortune.
When Manchester City create 2.8 xG but only score once, that’s information the market often ignores. When Brighton generate 0.4 xG but somehow nick a 2-1 win, the bookmakers usually price their next match as if they’d genuinely outplayed their opponents.
This is where your edge lives.

The Five-Minute Value Hunt
Step One: Identify Performance Outliers (60 seconds)
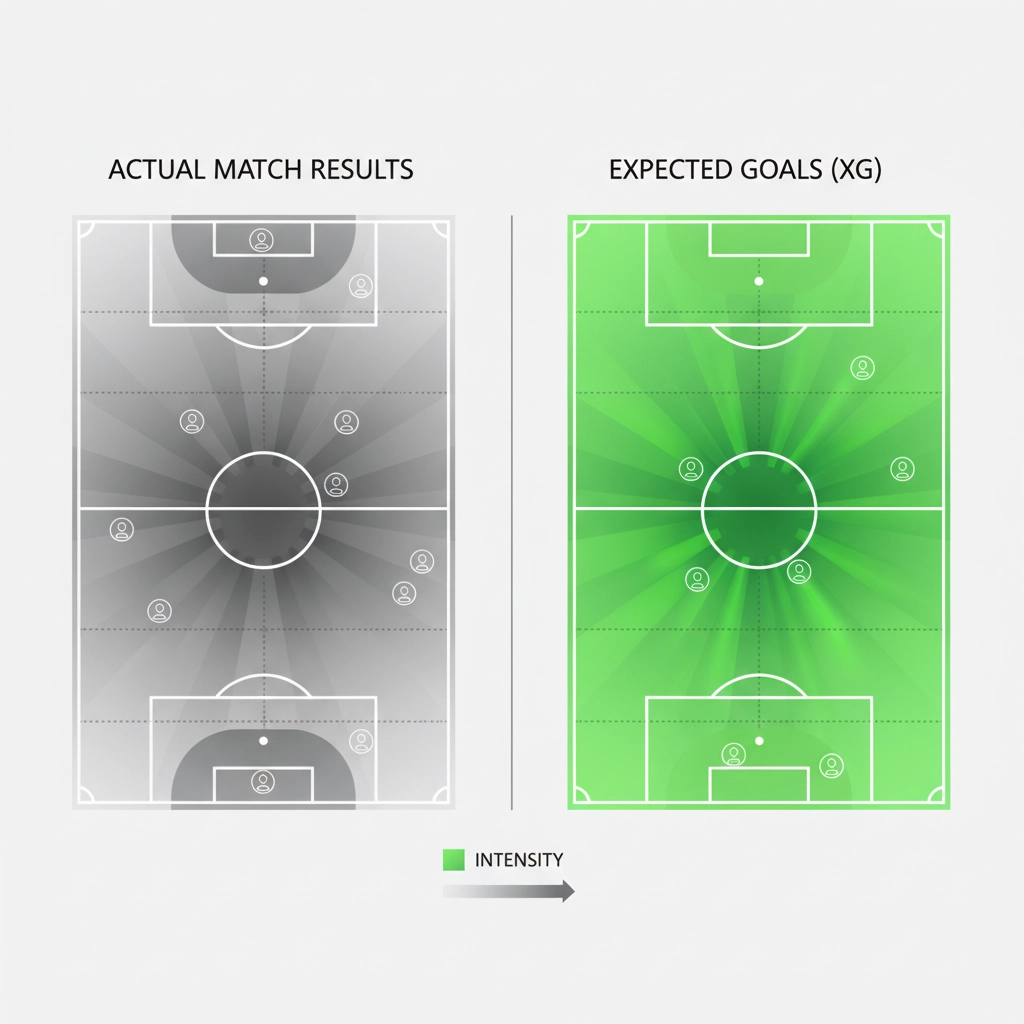
Start with last weekend’s matches. Look for games where the final score and xG tell completely different stories.
Find a team that won 2-0 but only created 1.1 xG whilst conceding 2.4 xG to their opponents. This is a lucky winner: they’ve stolen points they didn’t deserve.
Equally valuable are the unlucky losers. A side that dominated with 3.2 xG but somehow lost 1-0 after their keeper had a nightmare and the opposition scored from their only decent chance.
The market typically prices these teams based on the result, not the performance. That’s your opening.
Step Two: Check Recent xG Trends (90 seconds)
One match can be an anomaly. Five matches reveal a pattern.
Look at your selected team’s xG and xGA over their last five fixtures. Are they consistently creating good chances but failing to convert? Are they conceding high-quality opportunities but somehow keeping clean sheets?
Unsustainable patterns don’t stay unsustainable forever. Mathematics has a way of catching up with luck.
A team averaging 2.1 xG per game but only scoring 0.8 goals per game won’t stay that unlucky. Conversely, a side conceding 2.3 xG per game but somehow only shipping 0.6 goals per game is living dangerously.
Step Three: Compare League Position to Expected Position (45 seconds)
This is where Expected Points (xP) becomes your secret weapon. Many sites now show where teams should be sitting based on their underlying performance rather than actual results.
A team sitting 15th but performing like a 9th-place side represents value, especially if the market hasn’t caught on. The reverse applies to overperformers riding high on fortune rather than fundamentals.
The bigger the gap between actual and expected position, the more compelling the value opportunity.
Step Four: Assess Finishing and Goalkeeping Quality (30 seconds)
Quick check on Expected Goals on Target (xGOT) if available. This tells you whether teams are over or underperforming their big chances.
If a striker is converting half-chances into goals well above xG expectations, that’s unsustainable. If a quality forward is missing sitters, that typically corrects itself.
Same principle applies to goalkeeping. Shots that should find the net based on placement and power don’t keep missing indefinitely.
Step Five: Cross-Reference with Market Odds (45 seconds)
Now compare your findings with the bookmakers’ assessment. Are they pricing the lucky winners as genuine title contenders? Are they writing off the unlucky losers based on recent results rather than underlying metrics?
When there’s a clear disconnect between xG analysis and market pricing, you’ve found your value opportunity.
Common Traps That Catch Most Punters
Over-relying on single-match xG data. One game means nothing. Five games start to paint a picture. Ten games give you confidence.
Ignoring context completely. A 0.2 xG performance might be terrible for Manchester City but perfectly acceptable for a newly-promoted side parking the bus away to Liverpool.
Assuming all regression happens immediately. Unlucky teams don’t always bounce back in their next match. Sometimes it takes several games for the underlying metrics to manifest in results.

A Real-World Example
Let’s say you’re analysing Nottingham Forest ahead of their weekend fixture. Their recent results show two wins and a draw: decent form that has shortened their odds.
But the xG data tells a different story:
- Match 1: Won 2-1 (0.9 xG for, 2.1 xG against)
- Match 2: Drew 0-0 (0.4 xG for, 1.8 xG against)
- Match 3: Won 1-0 (1.1 xG for, 2.3 xG against)
Forest have taken seven points from nine despite being comprehensively outplayed in all three matches. They’ve averaged 0.8 xG whilst conceding 2.1 xG per game: that’s relegation-form underlying performance masked by unsustainable results.
The market has shortened their odds based on recent points collected. But xG analysis suggests they’re due a reality check.
That’s valuable information you can act on in their next fixture.
Technology Makes This Simple
Modern football analysis doesn’t require spreadsheets or manual calculations. The data exists: you just need to know where to look and what it means.
Gecko Edge processes exactly this kind of information to highlight value opportunities that traditional analysis misses. Built for bettors, powered by AI: because identifying these patterns manually is possible, but automating the process lets you focus on what matters: making profitable decisions.
The Bottom Line
Value betting isn’t about predicting the future: it’s about recognising when the present doesn’t match recent past performance.
xG analysis gives you that insight in minutes, not hours. It cuts through the noise of results-based thinking and focuses on the process that ultimately drives outcomes.
Lucky streaks end. Unlucky runs correct themselves. Quality eventually shines through.
Your job is spotting these transitions before the market catches on. With xG data, that becomes surprisingly straightforward.
Five minutes of focused analysis beats five hours of reading transfer gossip and injury updates. The numbers don’t lie( they just wait for you to listen.)